Radiologist report:
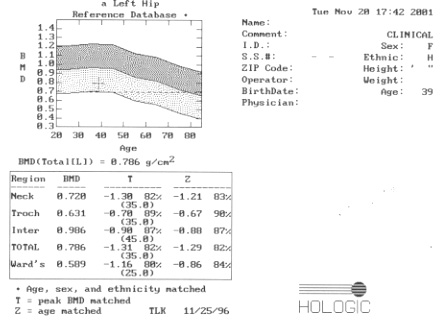
"This is a 39-year-old Hispanic female with a previous history of
osteoporosis, to be compared to previous scans from the year 2000.
At the hip, total bone mineral content is 27.41 grams with an average
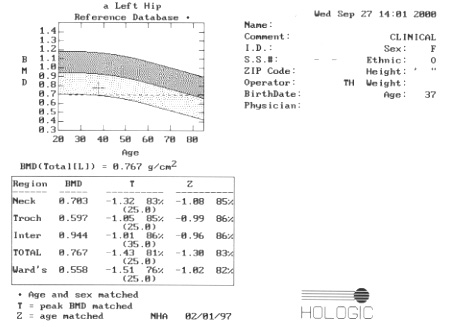
bone mineral density of 0.786 grams/cm sq. . . . When these values at the hip are compared to previous hip
measurements dating to 9-27-2000, there has been a significant
improvement in hip BMD of +2.5%"
Why do these graphs look so different? Why did the total hip BMD and T-score get better while the Z-score hardly changed? In the femoral neck, why did the BMD get better, the T-score didn't change, while the Z-score got worse?
Updated 8/8/05

|
 |