Soils and Sensitive Areas
Introduction:
In designing a harvest design, there are many factors that need to be considered when locating harvest and construction areas. The Habitat Conservation Plan (HCP) provides the more important critical areas. Once these areas are designated, you must next identify areas sensitive to mass wasting and areas where construction won't be a problem. The Washougal basin for Skamania County, Washington, consists of varying topography, soil types, streams and timber areas. In order to complete this analysis we used information from the FE 423 Washougal Watershed Analysis `98. We used the Soil Layers and Mass Wasting Module to recreate maps and tables to use in this analysis.
Unfortunately, this analysis is not complete because we do not have all the information for our watershed. The information originated from the state Department of Natural Resources survey of forestlands. Because the survey was intended for tax purposes, a complete survey was not conducted. This left out the North and Northwest regions of our watershed. Hence, our analysis is only accurate to a limited degree.
Methods and Results:
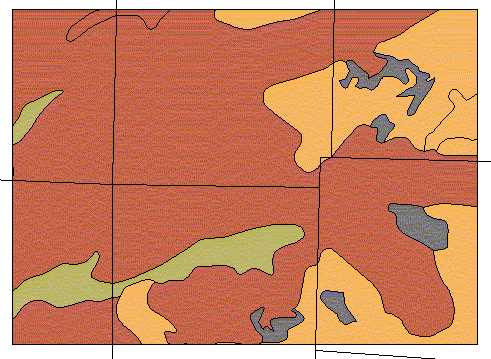
The first analysis will be on the soil types. By knowing the soil types, you can then determine what type of heavy equipment can be used. Figure 1 is a map of the soil types and their locations in the Washougal Watershed. We attained this map from the Soils Layer in the Washougal `98 Watershed Analysis. This map was created by using the GIS information, 30 by 30 DEMs, which were provided by the DNR.
|
|
|
Figure 1. Soil identification and location for our harvest unit in the Washougal basin, where Zygore, Aschoff, Rock Outcrop and Washougal are the four major soil types. (Note: Hagen, Hartnit, and Olyic do not have soil information.)
Once the soil types have been identified, we need to assign a classification to each soil and describes its soil operability, see Table 1. In order to assign a limit as to what is good and poor operability, a limit is set at the percentage of soil passing through a 200 sieve, where 30% is the limit. 30% was decided to be the "cutoff" because for gravels and sands the percent passing is not greater than 30 - 35% (See table13.A and 11.A in Soil Survey of Skamania County Area, Washington, October 1990).
Table. 1 Soil stability
|
Soil Type |
USCS |
Soil Operability |
|
Andic Cryumbrepts |
CL |
Poor - high hazard and restrictions |
|
Arents |
GM |
Good - no restrictions |
|
Aschoff |
GM |
Good - no restrictions |
|
Bonneville |
GP |
Good - no restrictions |
|
Dougan |
GM |
Good - no restrictions |
|
Hesson |
CL |
Poor - high hazard and restrictions |
|
Kinney |
ML |
Poor - high hazard and restrictions |
|
McBee |
CL-ML |
Poor - high hazard and restrictions |
|
McBee Variant |
|
|
|
Mossy Rock |
ML |
Poor - high hazard and restrictions |
|
Pilchuck |
SM |
Good - some fines, no restrictions |
|
Pits |
SP |
Good - no restrictions |
|
Riverwash |
GW |
Good - no restrictions |
|
Skamania |
SM |
Poor - many fines, high hazard and restrictions |
|
Skamania Variant |
|
|
|
Skoly |
GM-GC |
Good - no restrictions |
|
Steever |
GM-GC |
Good - no restrictions |
|
Typic Dystrandepts |
SM |
Poor - many fines, high hazard and restrictions |
|
Washougal |
GM |
Good - no restrictions |
|
Xerorthents |
SM |
Poor - many fines, high hazard and restrictions |
|
Zygore |
GM |
Good - no restrictions |
We also based this soil operability on the characteristics, such as cohesion and saturation conductivity, that greatly affect the use of heavy equipment within the soil. Gravels, gravelly, sand, or sandy soils are highly favorable when using heavy equipment. There are no restrictions for using equipment in this soil type. Slopes of roads may be a maximum of 30 - 35%, even under wet conditions. However, silt, silty, clay, clayey or ash soils are not favorable when using heavy equipment. The higher the fine content, the greater the hazard and restriction of equipment usage. Slopes of roads may not exceed 20%. Roads and operations are often shut down during wet conditions, approximately 9 months for Western Washington.
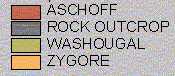
Now we can identify areas that are sensitive to mass wasting. This data was taken from the Mass Wasting Module in the Washougal `98 Watershed Analysis. These maps were created by using Arc Macro's, AMLs. These AMLs allow us to create programs that utilize the information provided by the DNR and other Modules. The first map, Figure 2, utilizes the Shaw-Johnson model to identify areas of hazard. This model utilizes slope and curvature of the topography.
Slope %
|
|
0-15 |
15-25 |
25-47 |
47-70 |
70+ |
|
Convex |
Low |
Low |
Low |
Low |
Medium |
|
Planar |
Low |
Low |
Low |
Medium |
High |
|
Concave |
Low |
Medium |
High |
High |
High |
Figure 2. This map utilizes the Shaw-Johnson model to determine areas and the degrees of hazard based on topography.
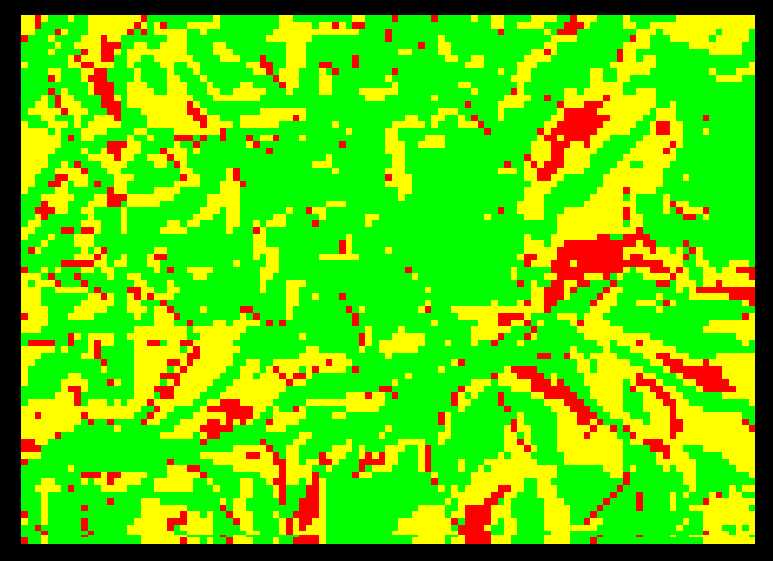
The next map, Figure 3, shows the Probability of Failure, according to soil type and steepness. This map was also generated through AMLs, which used information from the Soils Module. The Probability of Failure map represents the probability that soil thickening since the last fire will push the soil beyond its critical thickness. As you can see, the areas of black are areas of NODATA. For some soil types, the values for soil cohesion and conductivity were zero. Unfortunately GRID does not execute any equation where zero values are present, which result in a NODATA value.
Probability of Failure
¨
High Potential for Failure¨
Low Potential for Failure¨
No Data Available¨
Streams for Type 1-3
Figure 3. This map shows areas of sensitivity for the Washougal Basin, by using the Probability of Failure equation. This equation is based on soil type and topography.
Although the map of the Probability of Failure is not completely accurate, it can still be used in making predictions of possible failure. Because the Pfail equation is based on the friction angle of the soil and the soil angle slope, it is safe to assume that the probability of failure in these NODATA areas are moderate to high. If you look up the soil values for these areas, they are mostly zero, which reflects poor stability. We can base this prediction off of the Soils data and other related maps, such as the Map of Potential Hillslope Equation.
Conclusion:
As you can see, our harvest unit is fairly stable. According to the soil map, all areas are accessible to heavy equipment. In looking at the topography, it is recommended to not include or be cautious of the ridge tops. Because this data was achieved through other sources and is quite dated, it may not be very reliable. The only way to be precise is to perform our own field study. We can now use this information in PLANS to determine areas where construction and logging may occur.
References:
Food and Agriculture Organization of the United Nations. Watershed Management Field Manual: Landslide
Prevention Measures (13/4). September 1988.
Food and Agriculture Organization of the United Nations. Watershed Management Field Manual: Road Design and
Construction in Sensitive Watersheds (13/5). March 1989.
Hurvitz, Philip. Personal Interview. 18 January to 11 March 1998.
Krogstad, Finn. Personal Interview. 13 January to 11 March 1998.
Schiess, Peter. Personal Interview. 18 January to 11 March 1998.
United States Forest Service. Level 1 Stability Analysis (LISA) Documentation for Version 2.0. April 1992.
Reference Links: