Appendix C
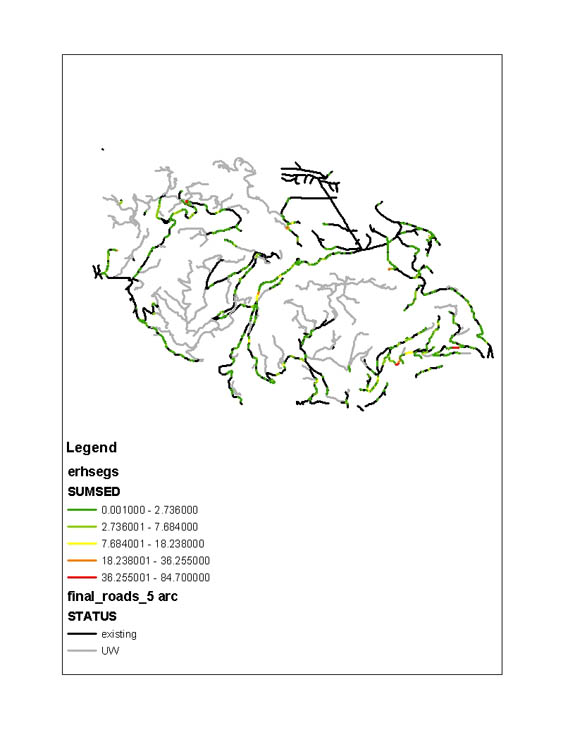
CULSED is a decision support tool developed at the University of Washington in order to assist engineers with cross drain system design. This tool is capable of helping the road designer arrive at sub-optimal culvert spacing that will reduce sediment impacts to the neighboring stream networks. Each culvert location is evaluated for its potential sediment delivery and graphically displayed accordingly with proportional symbols. The two most important aspects considered when evaluating a culvert location are: the sediment production associated with the contributing road prism draining to the location in question and the potential for dispersion and sediment filtering on the side slope. Internal models analyze the pertinent factors around the questioned location to calculate the sediment production and filtering potential respectively. Using these calculated amounts, a potential sediment delivery to the stream is associated to a culvert and reported in tons per year. The goal of the road designer using this program is to explore various culvert locations until the sum of all sediment delivery from the road network approaches minimum values. It is important to note that this program has been designed as a decision support tool as opposed to a sophisticated sediment analysis tool, denoting that cross drains are analyzed on a relative scale and the associated absolute sediment values may or may not accurately reflect reality.
CULSED is implemented as an ArcMap extension and has been tested with versions 8.1, and 8.2. The sediment computations are based on the Washington DNR Manual for Conducting Watershed Analysis and on empirical results obtained by Ketcheson and Megahan of USDA Forest Service. The program accepts as inputs a Road Layer, a Stream Layer, an Existing Culverts Layer and a Digital Elevation Model (Fig. 1). The factors influencing sediment production such as: road grade, surface material, road width, road age, side slope vegetative cover and traffic can be specified as attributes of the road layer.
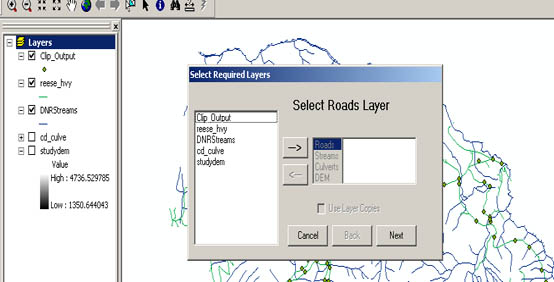
Figure 1: Culvert Placement Requirements.
We used CULSED during this project to determine valid location for cross drain culverts for the UW planned roads and also to examine a possible reduction in sediment delivery from the existing DNR roads in our planning area.
A first run of the sediment modeling for the UW planned roads without cross drains in place revealed a high amount of sediment delivered: 297 ton/year (fig 2). These figures seemed unrealistically high. We believe that this had to do with the fact that the roads were analyzed as new and the soils in this region were considered easily erodible. However at this stage of the analysis we were not concerned with the accuracy of the absolute results but with finding locations for the future cross drains. A high variability in sediment reaching stream crossings as represented by the yellow dots can be observed in figure 2.
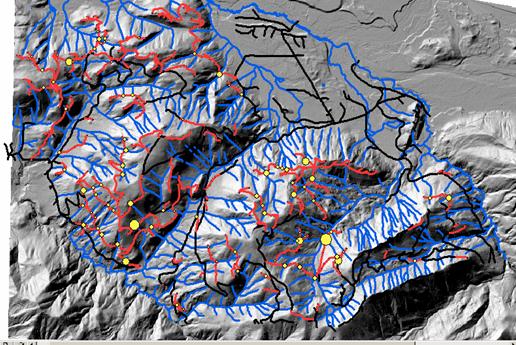
Figure 2: Initial sediment delivery for UW planned roads (in red) of 297 ton/year.
The yellow dots represent stream crossing. There are no cross drains.
At this point we proceeded to design our drainage system. The first iteration adding cross drains at key locations along the road alignments led to an important reduction in sedimentation. After this first pass our network delivered only 78.5 tons of the initial computed amount, obtaining a reduction of 74%. Figure 3 shows the cross drains and stream crossing culverts delivering sediment in excess of 1 ton per year.

Figure 3: Sediment delivery from UW proposed roads with cross drains in place - 78.5 ton/year.
Yellow dots represent culverts delivering in excess of 1 ton/year.
To further refine our design we needed to represent the sediment delivery at a much finer scale. Figure 4 shows all culverts in our network drawn at a proportional scale with the minimum value of 0.1 tons per year. By doing that we increased the amount of detail on the map in order to see where we could focus our attention to further reduce sedimentation. Notice the apparent higher variability in dot size as compared to figure 3.
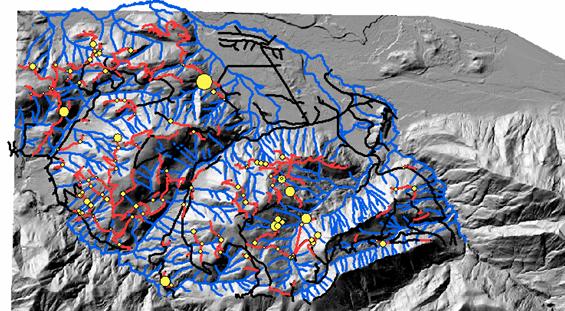
Figure 4: Sediment delivery from UW proposed roads with cross drains in place - 78.5 ton/year.
Yellow dots represent culverts delivering in excess of 0.1 ton/year.
By exploring other culvert locations and by adding a few more cross drains during a second iteration we managed to reduce sedimentation to 56.2 tons/ year. Thus a further 28% reduction was obtained. Figure 5 represents the total sediment delivery from culverts at the same 0.1 tons/year scale. It is easy to observe graphically how the location and number of culverts affect total sediment delivery to the stream network.
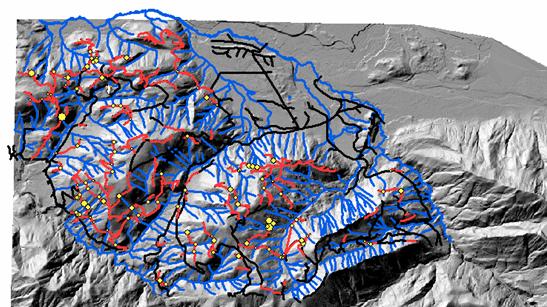
Figure 5: Sediment delivery from the UW proposed roads after the second iteration
of placing cross drains. Total amount 56.2 Tons/year.
A similar study was performed for the existing DNR roads. We started with the existing culverts in place and tried to reduce the sediment delivery by exploring new locations. Figure 6 presents the original case scenario, reflecting the current reality in the field. Again the total sediment produced seemed high at 86.2 tons/year. We assume that the sediment model within CULSED is not very accurate but we rely on consistent error and relative scale to compare culvert locations.
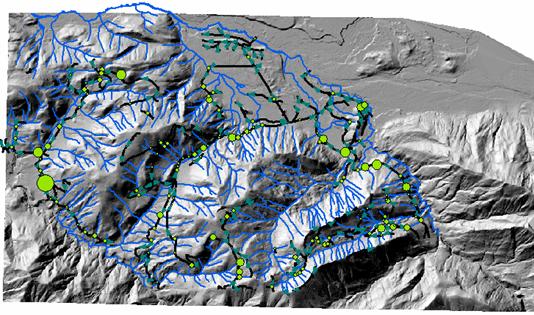
Figure 6: Original sediment delivery from existing DNR roads. - 86.2 Tons/year.
Green dots represent proportional delivery from culverts.
Restructuring this cross drain system by moving some of the original DNR cross drains to more appropriate locations we were able to accomplish a potential reduction of almost 39%, from the initial 86.2 to 53.3 tons per year, as seen in Figure 7.

Figure 7: Sediment delivered by existing DNR roads after restructuring
cross drain system by exploring other cross drain locations. -53.3 Tons/year.
During this process we have learned that by placing cross drains at key locations it is possible to obtain significant reductions in sediment delivery to stream networks by using the filtering properties of side slopes. The most efficient locations seemed to be in the vicinity of a stream crossing, within 100 - 200 feet along the road. We also learned that using tools such as CULSED together with high resolution elevation models can lead to a more efficient design, potentially shortening the field verification phases.
In order to compute a more accurate potential sediment delivery from our road network, we called upon Sedmodel2 as a current accepted standard among specialists in this field. The results of our analysis are presented below.
Sedmodl2
Sedmodl2 variables
Road Use Type Item Value
===================================
MODERATE M
HEAVY H
---------------------------------
VARIABLES TO BE USED BY THE MODEL
---------------------------------
Soil Depth: 36
Bulk Density: 1.4
Min Soil Creep: 0.040
Max Soil Creep: 0.080
Cutslope cover: 40%
The above conditions (or input parameters were then applied toa road ystem/pattern based on a harvest sequence as determined by NETWORK 2000 model. The Network model provides us with a road use pattern based on time an dlocation of harvest as well as a traffic/haul load based on timber volume using a particular segment. For each harvest period a road use pattern can be established and from it a corresponding sediment generation map can be created. Thes are probably the most important data for any RMAP process.
Sedmodl output map
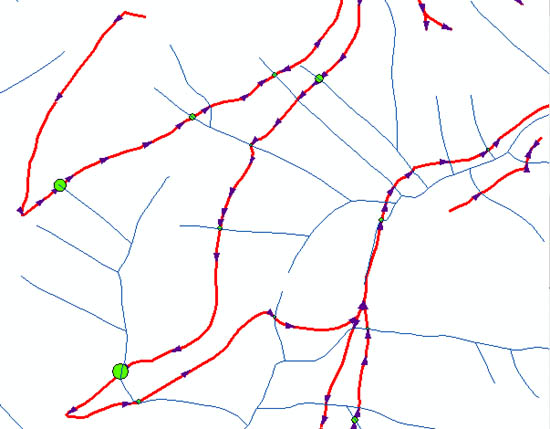
Figure 8: Before 299 tons/year.
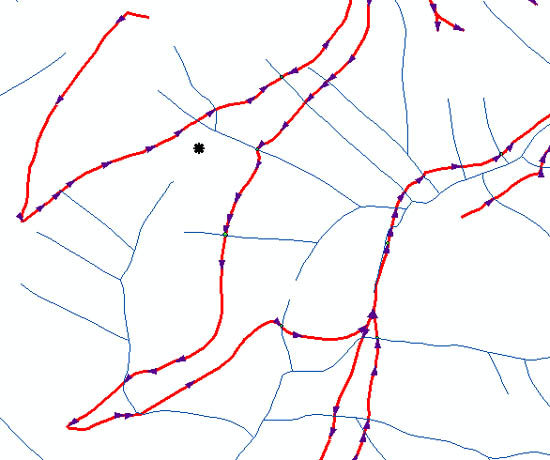
Figure 9: After 252 tons/year 5 culverts placed.
Sedmodl2
Sedmodl2 variables
Road Use Type Item Value
===================================
MODERATE M
HEAVY H
---------------------------------
VARIABLES TO BE USED BY THE MODEL
---------------------------------
Soil Depth: 36
Bulk Density: 1.4
Min Soil Creep: 0.040
Max Soil Creep: 0.080
Cutslope cover: 40%
Sedmodl output map