
Appendix B Seral Stage Distribution by Five Year Period

|
-35 |
Stands younger than 35 years. |
|
-45 |
Stands between 35 and 45, eligible for thinning. |
|
-70 |
Stands between 45 and 70, unthinned. |
|
-100 |
Stands between 70 and 100, unthinned, eligible for harvest. |
|
-70T |
Stands between 40 and 70, thinned. |
|
-99T |
Stands between 70 and 100, thinned, available for harvest. |
|
100+ |
Stands, thinned or unthinned, over 100 years and unavailable for harvest. |
This appendix displays the spatial distribution of various seral stages across the landscape over the seventy year rotation.
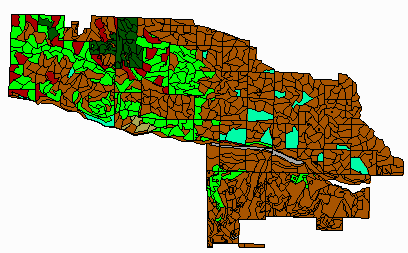
Figure B.1 Seral Stage Distribution from 1997 to 2002.
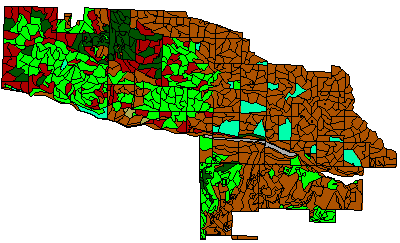
Figure B.2 Seral Stage Distribution from 2002 to 2007.
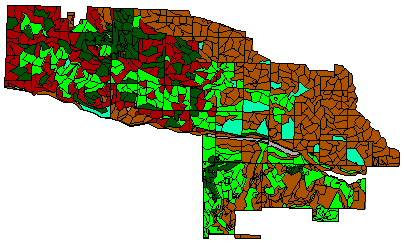
Figure B.3 Seral Stage Distribution from 2007 to 2012.
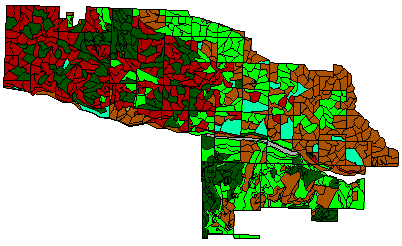
Figure B.4 Seral Stage Distribution from 2012 to 2017.
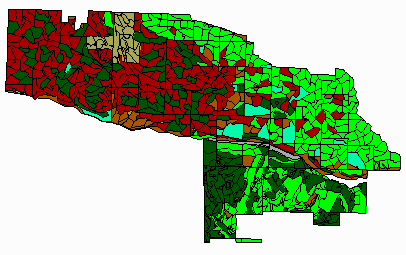
Figure B.5 Seral Stage Distribution from 2017 to 2022.
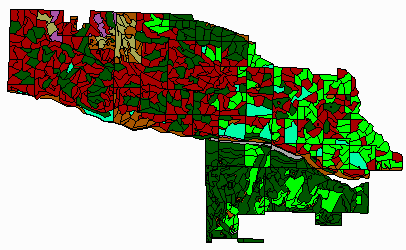
Figure B.6 Seral Stage Distribution from 2022 to 2027.
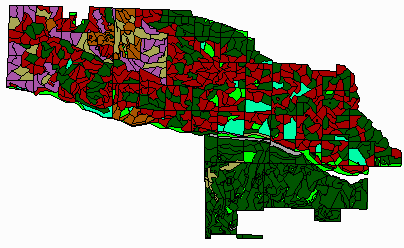
Figure B.7 Seral Stage Distribution from 2027 to 2032.
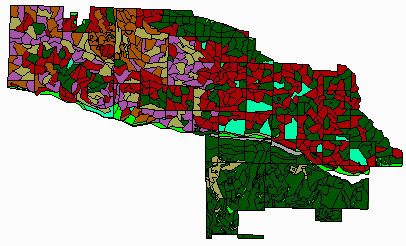
Figure B.8 Seral Stage Distribution from 2032 to 2037.
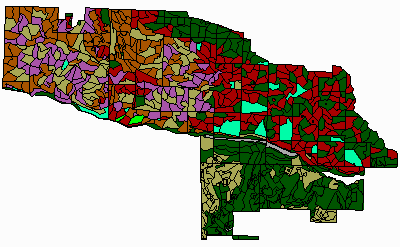
Figure B.9 Seral Stage Distribution from 2037 to 2042.
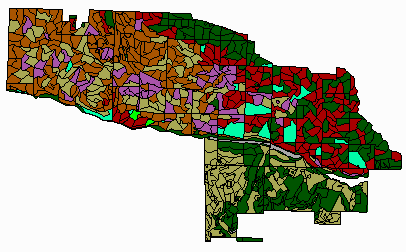
Figure B.10 Seral Stage Distribution from 2042 to 2047.
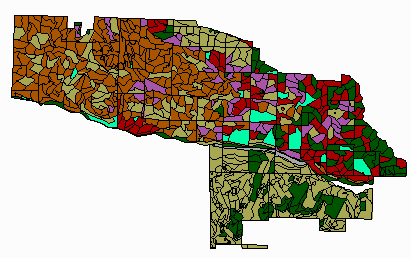
Figure B.11 Seral Stage Distribution from 2047 to 2052.
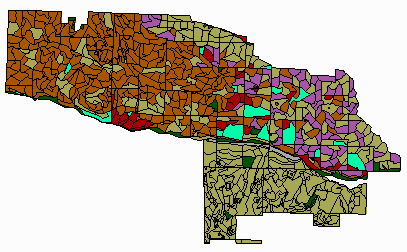
Figure B.12 Seral Stage Distribution from 2052 to 2057.
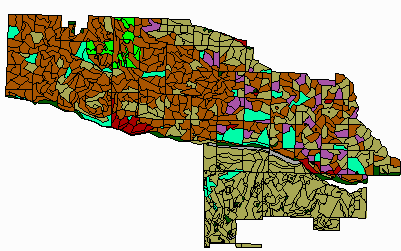
Figure B.13 Seral Stage Distribution from 2057 to 2062.
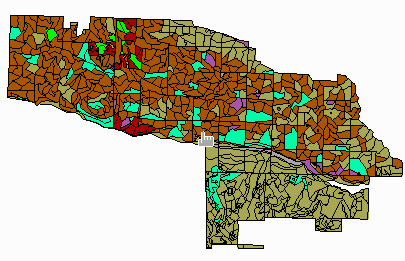
Figure B.14 Seral Stage Distribution from 2062 to 2067.