|
|
FM/FISH 328
Forestry-Fisheries Interactions |

|
Assignment 2: Soil – water |
Due: Solutions
|
Format
Turn
in the assignment via e-submit (either pdf or MS
Word).
Make
sure to reference your answers, where appropriate with links, references etc.
Problem 1 15/15
Find
the Mashel river stream gauge record and
a) provide data on the
information provided (e.g. gage identifier, records kept)
Location:
Latitude 46°51'25", Longitude 122°18'05" NAD27,
http://wa.water.usgs.gov/ Latest River Conditions
http://waterdata.usgs.gov/wa/nwis/inventory/?station=12087000
http://nd.water.usgs.gov/canoeing/pdf/paddling.pdf
water levels for kayak/canoing enthusiasts
b) The gage is located in
the vicinity of a particular highway, which one is it?
Highway 7
"LOCATION.--Lat
46°51'25", long 122°18'05", in NW 1.4 SE 1.4 sec.21, T.16 N.,
R.4 E., Pierce County, Hydrologic Unit 17110015, on
left bank, 50 ft
downstream from State Highway 7 bridge, 1.8 mi northeast of La Grande, and at
mile 3.3."
http://pubs.usgs.gov/wdr/WDR-WA-02-1/data/12087000.2002.sw.pdf
http://cfpub.epa.gov/surf/huc.cfm?huc_code=17110015
c) Within which larger
drainage area or watershed is it located:
Nisquyally
http://pubs.usgs.gov/wdr/2005/wdr-wa-05-1/pdf/wa00103ADR2005_Figure24.pdf
d) Establish what the
record maximum flowrate was and when it
occurred.
|
1947 |
|
9.30 |
7,980 |
|
|
|
|
|
Quoted from
http://waterdata.usgs.gov/wa/nwis/inventory/?station=12087000
http://pubs.usgs.gov/wdr/WDR-WA-02-1/data/12087000.2002.sw.pdf
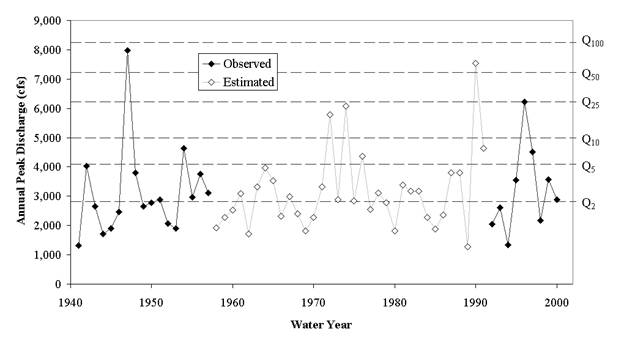 Figure 1. Annual peak flow series at the
Problem 2 20/20
Calculate
the 100-year event or flowrate that passes the Mashel gage station, using the “USGC method (outlined in DNR’s Watershed Manual, Hydrology Module).
Formula
for calculating run-off of peak flows.
QR = a x A b1
x Pb2 x (Fb3)
where F is the
effect of vegetation cover which for
Assume Mashel river is in region 2.
Constants from
table C-2 are;
a=.1945;
b1=.86;
b2=1.60
A (area) for Mashel watershed = 80.70 sq.
http://waterdata.usgs.gov/wa/nwis/inventory/?station=12087000
P
(mean annual precip.)
= 31”/year for this isocline
( a very nice
presentation from the DOT)
Period of Record Monthly Climate Summary; P = 38”
http://www.wrcc.dri.edu/cgi-bin/cliMAIN.pl?walagr
Using 31” for P and substituting we get;
Q=
.1945(80.7.86)(311.6 ) = 1,640 cfs
This
value is cleary too low, so we start to look at
alternatives
Since the Mashel
watershed does not have a rain gage in it, we check additional stations around it (Trimble and Ward, pg. 37, 43). The three closest rain gages are Rainier Longmire (82.79 in), Electron Headworks (67.69in), and La Grand (38.52 in). The average (arithmetic mean) of these gages
is 63 in. They do bracket the
drainage area.
Q100 = 0.194 * (80.70 mi2)0.86
* (63 in)1.60
Q100 = 6407cfs
Compare
the calculated Qmax for the 100 year event with the maximum flow rates on
record, any comments?
The Qmax of 6407 cfs for the 100 year event is very similar to the maximum flow rate if we treat the 7980 cfs as an outlayer or truly extreme (maybe 500-year event?) The 6407 cfs varies by only about 200 cubic feet from the next lower value. The next highest stream flow (to 1946) did not occur until 1996 and it was a full 1700 cubic feet less.
It is very difficult to standardize real life data into a mathematical equation. Especially when it is so easy to get variances in data. Variances could easily occur in the measurement of precipitation. For example, precipitation varies greatly by region, topography and landscape. Precipitation could be measured in various places nearby the Mashel river and the results would vary. For example, 72 inches would give a Q100 of 7933 which is almost the flow rate measured by the gauge.
http://www.wrcc.dri.edu/summary/climsmwa.html
Figure
1: Maximum flow rates recorded at Mashel stream gage
for period of record and calculated 100 year flow rate.
The calculated 100 year flow
rate is not highest rate ever to pass the Mashel
stream gage. It is greater then all the recorded flow rates except 1. During
the period of record, two maximum stream flows come into the range of the
predicted 100 year flow rate so flows of this magnitude do not occur on a
regular basis as is indicated with a 100 year flow rate.
Peak flow estimates by recurrence interval at the
|
Recurrence interval (years) |
Probability of occurrence
in any given year |
Discharge at gage # (cfs) |
Discharge upstream of
Little mashel (cfs) |
|
1.005 |
0.995 |
1,025 |
714 |
|
1.01 |
0.99 |
1,122 |
781 |
|
1.05 |
0.95 |
1,448 |
1,009 |
|
1.11 |
0.9 |
1,667 |
1,161 |
|
1.25 |
0.8 |
1,987 |
1,384 |
|
1.5 |
0.6667 |
2,353 |
1,639 |
|
2 |
0.5 |
2,821 |
1,965 |
|
2.33 |
0.4292 |
3,043 |
2,120 |
|
5 |
0.2 |
4,084 |
2,844 |
|
10 |
0.1 |
4,995 |
3,490 |
|
25 |
0.04 |
6,226 |
4,336 |
|
50 |
0.02 |
7,215 |
5,045 |
|
100 |
0.01 |
8,250 |
5,770 |
|
200 |
0.005 |
9,320 |
6,491 |
|
500 |
0.002 |
10,900 |
7,620 |
(Source
Technical Memorandum done in 2003 of the Mashel River
Preliminary Restoration Design by the Watershed Professionals Network, LLC
of Mount Hood, Oregon)
Problem 3 20/20
Write
a basic water balance equation for the Mashel
drainage, using the average mean annual stream flow for Run-off. Clearly state any assumptions. Use units of inches
P + RO + ET + delta Storage = 0
First off, we can assume that for average
years (which we are using), there will be no net gain/loss of storage.
Therefore delta Storage=0 and can removed from the equation.
P + RO + ET = 0
From chapter 2 (Stream corridor
processes) we get a rough value of <20 inches ET per year. This is the most
precise data I could find for this region. I will use 20 inches per year as the
figure.Another source puts it at 29” per year. It is
probably less, especially since we are looking at a region that is at higher
elevation than other reaches in the same isoline on
the source map.
P=31"
http://www.cflhd.gov/design/hyd/presentation31_schaefer.pdf
Area = 80.7 square mile = 323,969,310,720 square
inches
http://pubs.usgs.gov/wdr/WDR-WA-02-1/data/12087000.2002.sw.pdf
Annual mean stream flow from
http://nwis.waterdata.usgs.gov/nwis/annual/?site_no=12087000&agency_cd=USGS
RO = 227.8846 cfs (over recorded data range)
= 393,784.615 cubic inch/second
= 1.2426 x10¹³cubic inch/year
Divide this by the area (323,969,310,720 square
inches) and we get;
1.2426 x10¹³cubic inch/323,969,310,720 square
inches
RO= 37.3
inches.
Evapotranspiration records 20 - 29”
http://www.wrcc.dri.edu/htmlfiles/westevap.final.html
P + ET + RO = x
31 - 20 - 37 = 26
The
remainder is clearly too much to be explained by data issues or missing
parameters. However, if we use the
average P from the three surrounding rai gages (63”)
63
– 20 – 37 = 5”
This
value indicates that our base numbers for P and ET are reasonable and
variations can be explained with data variations , etc
Problem 4 5/5
For
erosion to occur what conditions have to be present
Erosion
can occur in almost any environmental condition when a strong enough force is
applied. There must be exposure of the soil and some method, or vector, for the
erosion to be caused. This can be livestock, agricultural/mechanical removal of
soil, water run-off, and/or
wind. It can be drastic as in, or it can be minor. Our main
concern is when erosion deposits material into streambeds or floodplains.
Erosion can also just remove valuable soil from a location and deposit
somewhere else, not necessarily into streams. Wind erosion was responsible for
the Dust bowl of the earlier part of the last century, though where the top
soil went was not as
much of a concern to the farmers as the plain fact that it went. The potential
is determined by slope, soil type, exposure, stability and many other factors.
Problem 5 20/20
Find
a description of a
Indianola soil
http://soils.usda.gov/education/facts/formation.html
http://soils.usda.gov/education/facts/
https://soilseries.sc.egov.usda.gov/osdname.asp
Classify
the
From 0” to 20” the
From 20” on, the series becomes larger smooth clean gravel and cobble
with some small coarse gravel. It is well graded and has rapid
permeability; GW
Indianola soil
https://soilseries.sc.egov.usda.gov/OSD_Docs/I/INDIANOLA.html
From 0” to 25” the Indianola series consists of
very fine to coarse sand,
is well graded and
has some organic matter. It is very
loose and well permeated. SW
From 25” to 60”, the series becomes fine silty
sand with trace fine organic matter and some pebbles. It is well graded and has rapid permeability; SM
Problem 6 20/20
In
a discussion about erosion and sediment deliveries to streams from roads a
statement is made that if a road is more than 200 ft away from a stream zero sediment
delivery is assumed.
Is
that correct? What is the argument for
such a statement?
Provide
a specific link to whatever source, citation, to substantiate your answer
The DNR erosion module
cites Burroughs and King on page B-9.[1] It states that, outside the 200 foot buffer
sediment delivery is assumed to be inconsequential because of the low
probability of delivery. The citation
comes from page 10 of the paper by Burroughs and King titled “Reduction of Soil
Erosion on Forest Roads”[2] This paper does not state directly that
sediment is inconsequential beyond 200 feet, rather it
makes statements that relate specifically to Horse Creek, in northern
“If the objective is to
prevent 80% of the relief culverts from contributing sediment to streams, a
distance of at least 175 feet must be provided between the culvert and the
nearest live water.”
This relationship is
based on a regression equation that predicts cumulative frequency (percent) of
sediment travel distances below fillslopes with the
influence of relief culverts based on the estimated transport distances in
feet.
The equation is:
Y = 98.9048 – 9.9044*10-13
* (625-X)5
Where Y = cumulative
frequency (percent) and X = transport distance (ft)
If you insert 175 feet
for the transport distance and run the equation. You get 80.62%, as stated in the paper. HOWEVER: if you enter 200 feet for the
transport distance and run the equation you get 85.17 percent. This means that only 85 percent of the
sediment is prevented from contributing to the streams at the 200 feet
distance. Because this study was
conducted on one stream in Northern Idaho and the statements in the DNR module
are blatantly false – outside a 200 foot buffer, sediment delivery is still 15%
of the total rather than “inconsequential,” – I find the DNR publication to be
misleading.
If
they had stated that sediment delivery was only 15% beyond 200 feet and that
was a figure they were determining to be “inconsequential” that would be
accurate. However by not stating a
figure and using the word inconsequential they are purposefully leaving out
potentially crucial