Chapter 6.5: Flow Charts
Organizing a program
A flowchart is a diagram which represents an algorithm or process, including a computer program. The goal is to show each step as a box of various kinds, and describe their order by connecting each box with arrows.
While most experienced programmers don’t bother with flow charts, they will be helpful in creating organized your code when you are a beginner. They are also pretty mandatory if you are trying to write code that will be used by other people, since they provide an easy way of allowing people to make sense of how you conceptualize your program.
There are many “types” of flow diagram, here you will be taught a relatively simple and informal version. Bear in mind that a flow chart is just a tool not an end in itself. So don’t spend a huge amount of time making it look pretty. It’s just a method of organizing your thoughts, the equivalent of an outline if you were writing a paper.
Symbols
A typical (old fashioned) flowchart has the following symbols:
Start and end symbols
Represented as circles, ovals or rounded rectangles, usually containing the word "Start" or "End", or anoth er phrase signaling the start or end of a process, such as "submit enquiry" or "receive product".
Arrows
Showing what's called "flow of control" in computer science. An arrow coming from one symbol and ending at another symbol represents that control passes to the symbol the arrow points to.
Processing steps
Represented as rectangles. Examples: "Add 1 to X"; "replace identified part"; "save changes" or similar.
Input/Output
Represented as a parallelogram. Examples: Get X from the user; display X.
Conditional or decision
Represented as a diamond (rhombus). These typically contain a Yes/No question or True/False test. This symbol is unique in that it has two arrows coming out of it, usually from the bottom point and right point, one corresponding to Yes or True, and one corresponding to No or False. The a rrows should always be labeled. More than two arrows can be used, but this is normally a clear indicator that a complex decision is being taken, in which case it may need to be broken-down further, or replaced with the "pre-defined process" symbol.
There are also a number of other symbols that have less universal currency, but you may find them helpful:
A Document represented as a rectangle with a wavy base;
A Manual input represented by parallelogram, with the top irregularly sloping up from left to right. An example would be to signify data-entry from a form;
A Manual operation represented by a trapezoid with the longest parallel side at the top, to represent an operation or adjustment to process that can only be made manually.
A Data File represented by a cylinder.
Flowcharts may contain other symbols, such as connectors, usually represented as circles, to represent converging paths in the flowchart. Circles will have more than one arrow coming into them but only one going out.
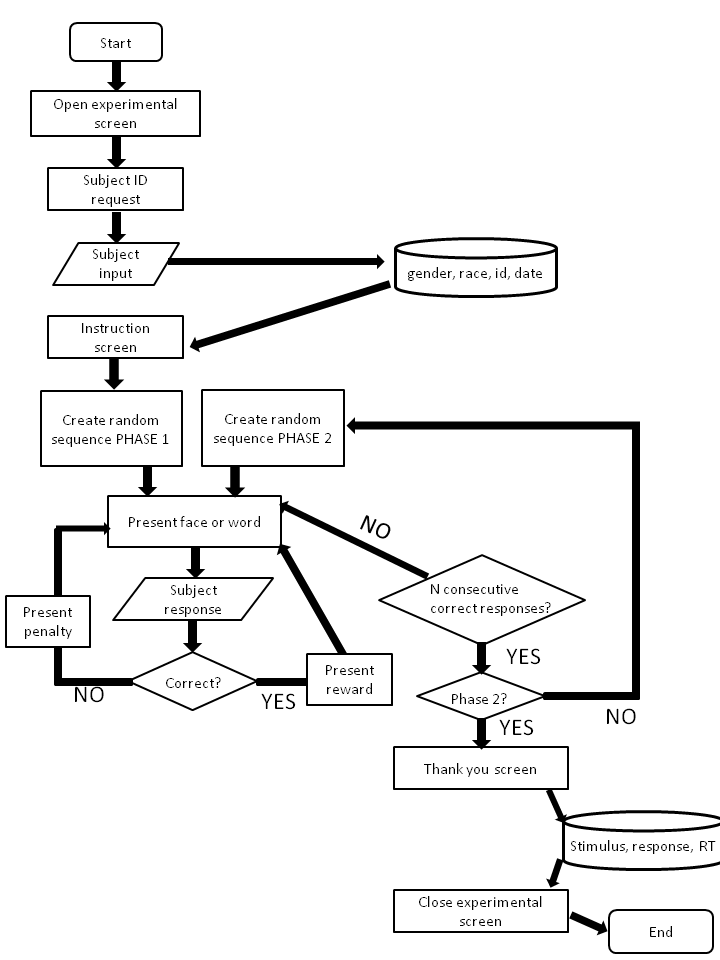
Example
An experiment examining the effect of racism using a variant of the Wisconsin card sorting task.
In the Wisconsin card sorting task subjects cards into two separate piles without instructions, and are rewarded/penalized when they sort correctly/incorrectly. After a while the subject learns the sorting rules. At a later point the sorting rules are changed without informing the subject, and the experimenters measure the number of trials it takes to learn the new rules of sorting.
Here we will use images of black and white faces, and positive and negative words.
Half the subjects will start with the rule that it is correct to categorize black and negative words as “1”, and white and positive words as “2”. Then the rule will switch so subjects have to categorize black and positive words as “1”, and white and negative words as “2”.
The other half of the the subjects will start with the rule that it is correct to categorize black and positive words as “1”, and white and negative words as “1”. Then the rule will switch so subjects have to categorize black and negative words as “1”, and white and positive words as “2”.
Hypothesis 1. That it will be harder to learn the Black+ve/White -ve pairing both in initial categorization and during re-categorization
Hypothesis 2. That “switching” strategies will be particularly difficult after doing Black+ve/White -ve since ‘inhibition’ will block switching strategies.
Trials needed to learn Black +ve/White -ve phase one / Trials needed to learn Black white negative phase two < Trials needed to learn Black -ve/White +ve Phase One / Trials needed to learn Black -ve/White +ve Phase Two