BUILDING ENERGY ANALYSIS
In 2000, the UW ME Department conducted an energy analysis for the National Park Service on the Marblemount Ranger Station, which serves North Cascades Nation Park. The full study is found in the MSME Thesis of Mr. Bo Vestergaard-Hansen.
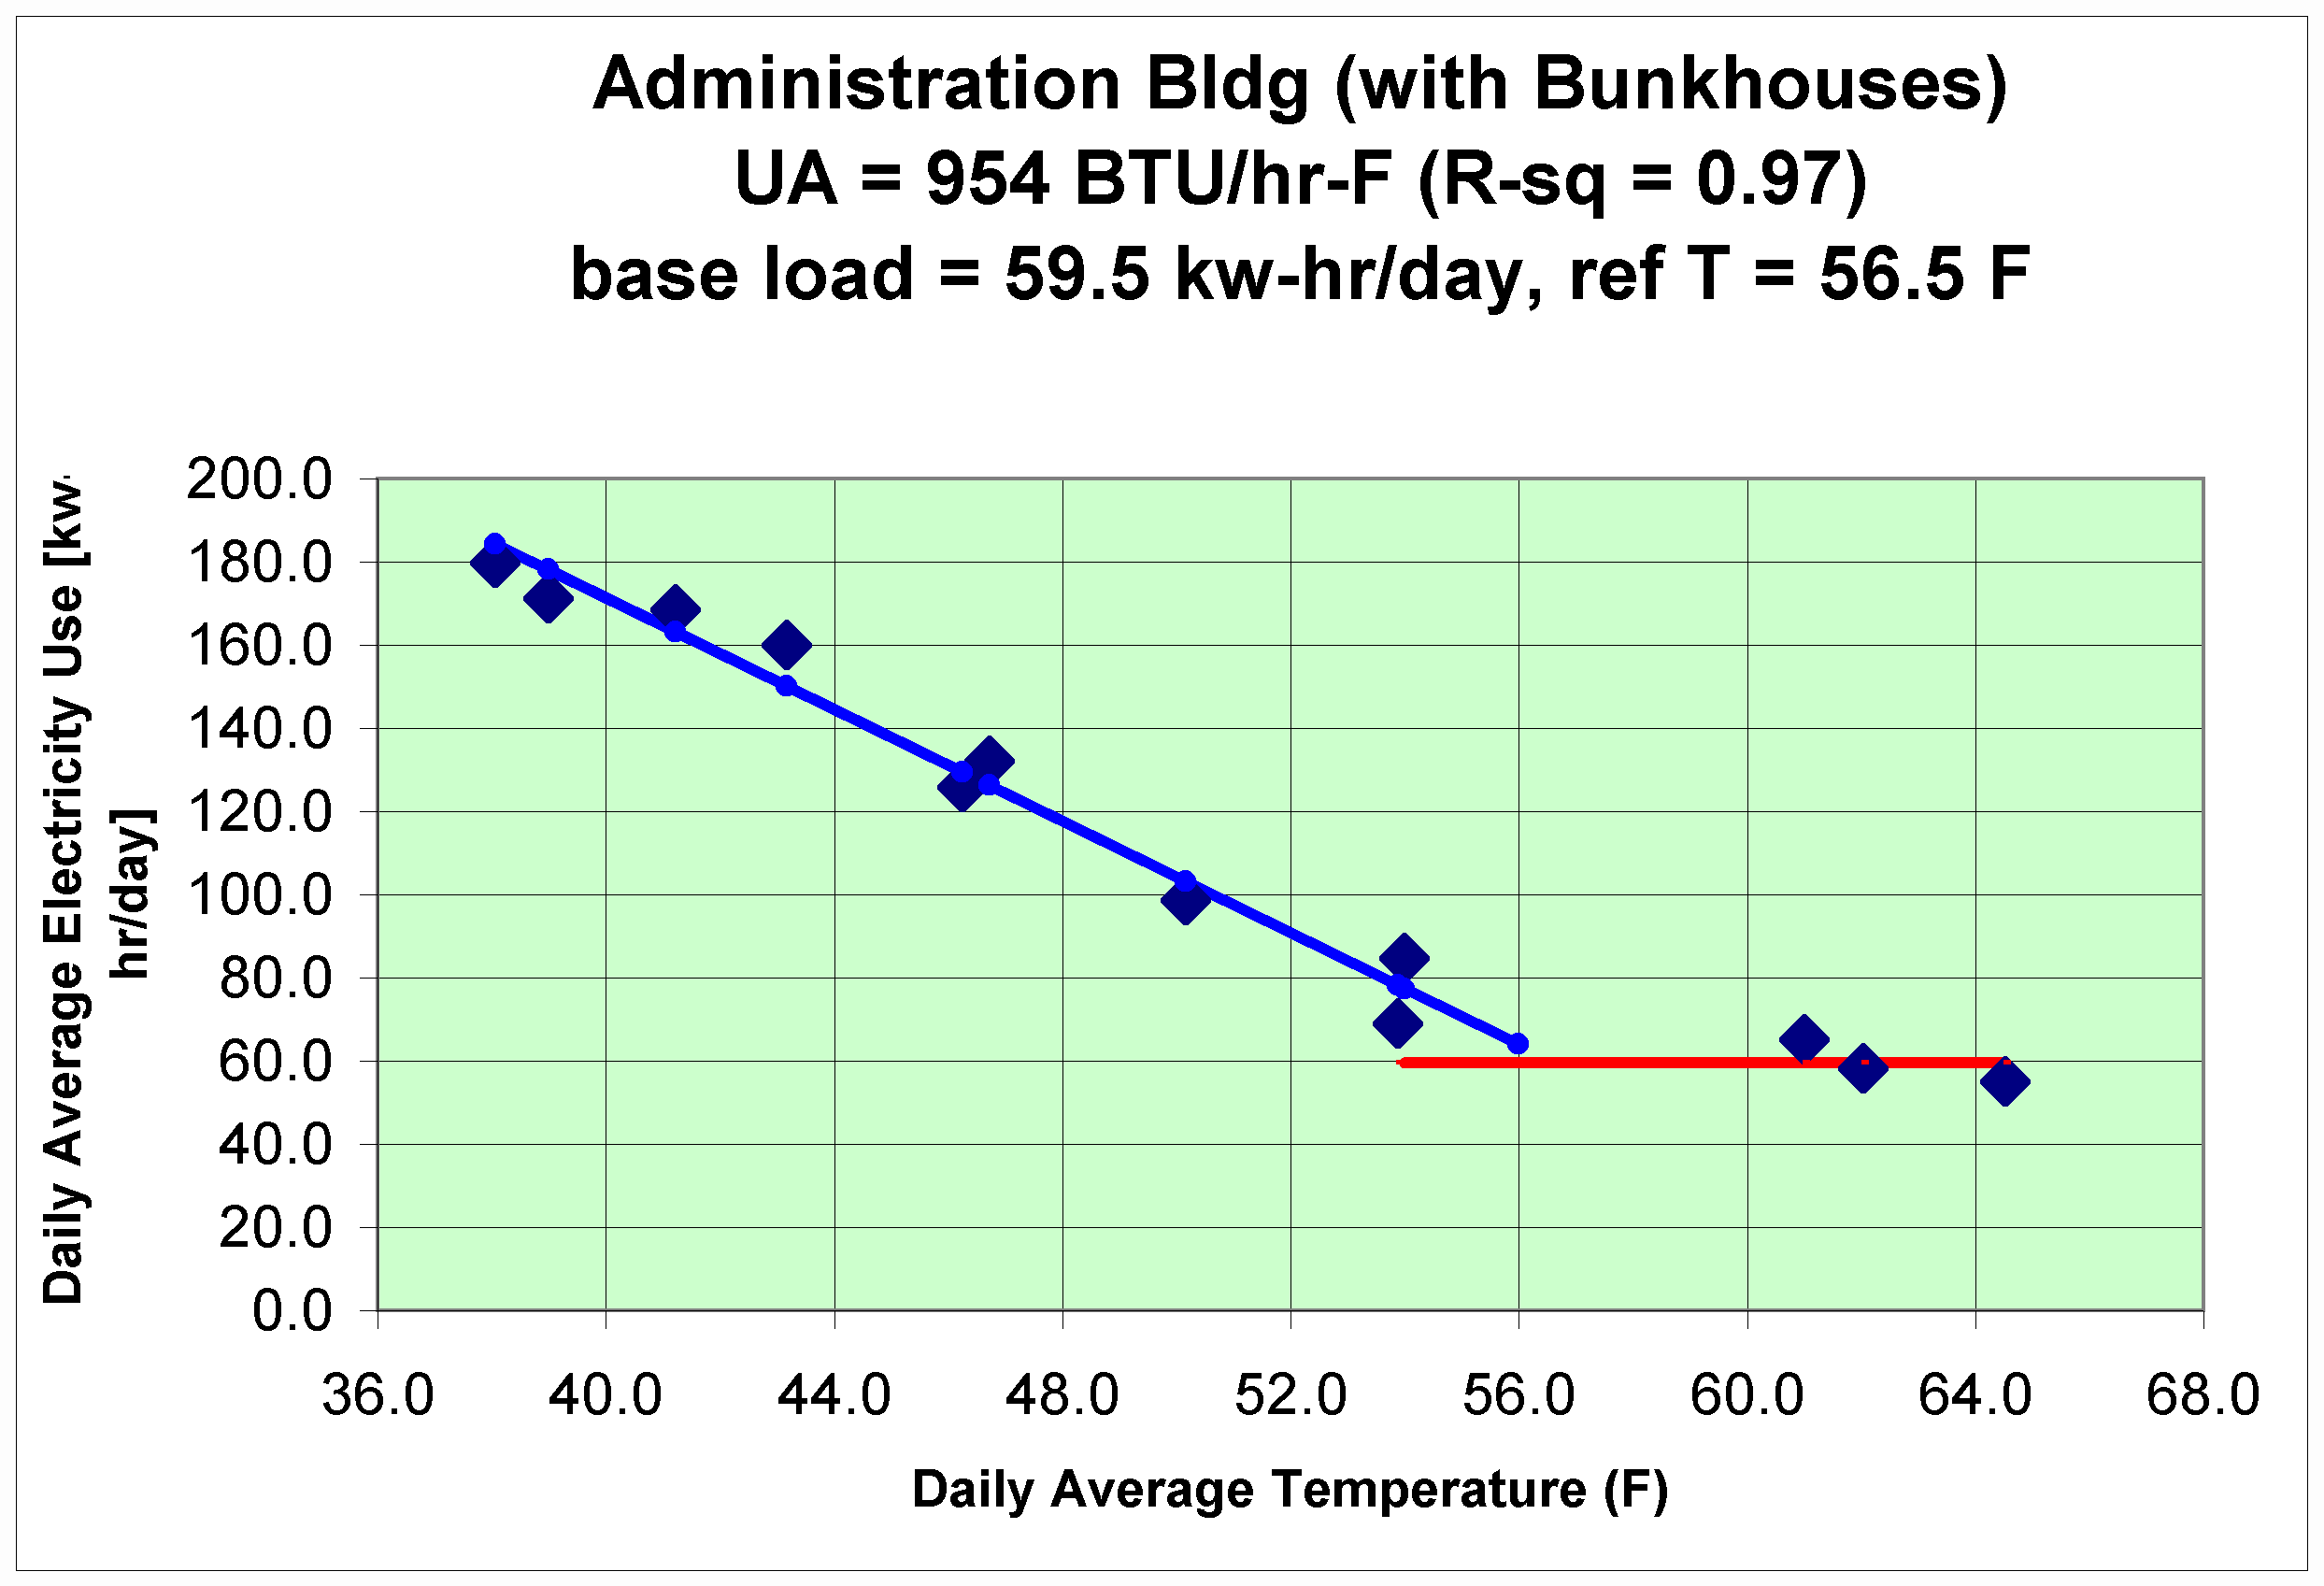
A few of the results from that study are shown and discussed below.
The plot below shows the average daily amount of electricity (as kwh) used by the Marblemount Ranger Station Administration Building (also with two bunkhouses, which are on the same electrical meter) versus the average outside temperature. All energy is provided by electricity. There is no natural gas service in the Skagit Valley and propane is not used for these buildings.
This plot has two key features:
The slope of the heating season line is 954 BTU/hr-F. That is, UA = 954 BTU/hr-F, where U is the conductance of the building and A is the surface area of the building.
When the average outside temperature is greater than 56.5 degrees F, the building heating system is not activated. That is, there is sufficient heat generated from personnel in the buildings, from lighting, from office equipment, and from appliances. This is called the reference temperature.
The heat transfer loss from the building (during the heating season) is expressed:
Q (BTU/hr) = U (BTU/hr-ft2-F) x A (ft2) x (Tref – Toutside)
On a following page, the UA factors for each type of heat loss, as estimated by Mr. Bo Vestergaard-Hansen, are listed. The sum of the individual UA factors is very close to the overall UA inferred from the electricity data plotted in the figure.
UA Analysis for Administration Building
|
U (BTU/hr-ft2-F) |
A (ft2) |
UA (BTU/hr-F) |
|
|
Windows (double glazed,¼ inch air gap, vinyl frame) |
0.64 |
303 |
194 |
|
Walls |
0.075 |
1240 |
93 |
|
Roof (attic has several inches of blown-in insulation) |
0.047 |
1746 |
82 |
|
Perimeter |
0.90* |
193** |
173 |
|
Infiltration |
96*** |
105**** |
|
|
Total for Ad Bldg |
647 |
||
|
Total with bunkhouses |
958 |
* BTU/hr-ft-F
** ft
*** cubic feet per minute (CFM)
**** CFM x 60 min/hr x 0.018 BTU/ft3-F
More info for windows
The table below contains R-values for several types of windows. Most of the R-values listed below are for the center of the glass (cog). They do not account for heat losses through the edges of the window. Thus, the overall R-values for the whole windows are lower than the cog values shown in the table. Remember, R designates the resistance to heat transfer, that is, the resistance to heat escaping from the built environment to the outdoors. Remember R = 1/U, where U = conductance.
The table also shows t, the transmissivity of the window to visible light. This is an important parameter for judging how well the window lets solar radiation into the built environment.
High R window keeps the thermal heat inside, while a high t window lets the solar heat (and light) inside.
The framing of the window also matters. With respect to maximizing the R-value of the whole window, wood is good (though more expansive), vinyl is good (though may deteriorate over time), and metal (as in aluminum) is not so good.
Glaze = pane of glass
|
Type of Window |
R (ft2-hr-F/BTU) |
|
Single-glazed |
R = 0.9 |
|
Insulating glass (IG), ie, double-glazed with ½ inch air gap between glazings |
R = 2.0 (cog) R @ 1.5 (whole window, ¼ inch gap) t = 0.70 |
|
IG with (soft) low-e coating added to the glazing |
R = 3.2 (cog) t = 0.52 |
|
IG with (soft) low-e2 coating adding to the glazings |
R = 3.5 (cog) t = 0.35 |
|
IG with (soft) low-e2 coating and with argon replacing air in the gap |
R = 4.4 (cog) R @ 3 (whole window) t = 0.35 |
|
IG with (hard) low-e coating and with air gap |
R = 2.9 (cog) t = 0.64 |
|
Very high R: coatings and with krypton in the gap |
R = 11 (cog) R = 7 (whole window) |
Now, two houses in the Seattle area are compared.
One house has a heating slope (UA) of about 1240 BTU/hr-F. See plot below. Four years of data are plotted for this house. This house is of about 3500 ft2 floor area, and uses natural gas for space and water heating and for the range-top stove. The gas use has been converted from therms to kwh and added to the electricity use to give the total kw (kwh/day/24) used. The other house is of 2000 ft2 floor area, is all-electric, and heats with a heat pump. Its overall UA is much smaller, about 310 BTU/hr-F.
Interestingly, both houses have the same reference temperature, 62 degrees F. This is greater than the reference temperature for the Marblemount buildings, since the houses are not heated as much by people and office equipment as the Marblemount Ad Bldg. Also, each house has a base load of about 1.75 kw.
The gas furnace is 80% efficient. The heat pump is about 200% efficiency.
Thus:
310/1240 = 0.25 @ 80/200 x 2000/3500 = 0.23
The respective slopes make sense. The smaller house with heat pump should use about ¼ the energy of the bigger house for heating.
(Note the efficiency of the heat pump is not 200% if one considers the losses in generating electricity. If the electricity had come from a coal-fired power plant, the overall efficiency of the heat pump would be about 200 x 0.33 = 67%. From a natural gas fired combined cycle power plant, the efficiency would be about 200 x 0.5 = 100%. Hydro-electric efficiency, from the potential energy of the water to the electricity delivered falls in the 50 to 70% range. For 70%, the overall efficiency of the heat pump is 200 x 0.7 = 140%.)
