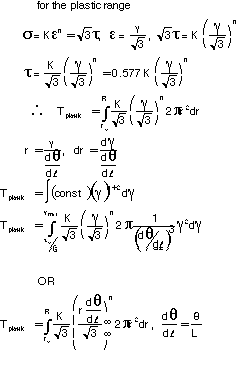
 ,
at 2° increments until 30° of rotation.
MGJ/10 OCT 96
PURPOSE
The purpose of this exercise is to obtain a number of experimental
results important for the characterization of materials. In particular,
the results from the torsion test will be compared to the results
of the engineering tensile test for a particular alloy using the
effective stress-effective strain concept.
EQUIPMENT
Constant-diameter gage section torsion specimen of 6061-T6 aluminum
Torsion test machine with grips, troptometer, and load sensor.
PROCEDURE
Measure the diameter (D=2R) of the gage section for each specimen to 0.02 mm.
Install the bottom end of the torsion specimen in the lower grip of the test machine. Rotate the lever arm as far to the right as possible. (Note: unscrew the horizontal threaded drive rod as much as possible).
Rotate the top grip as far as possible in the direction necessary to remove the 'slack' from the load cell cables and install the top end of the torsion specimen in the top grip of the test machine.
Zero the output of the load sensor.
Use the threaded drive rod to apply torque to the base of the
specimen and record the applied torque, T, versus angular rotation, ,
at 2° increments until 30° of rotation.
Remove the horizontal threaded drive rod and find the torque after 90° and 360° of rotation, being careful not to allow elastic unloading.
After 360_ of rotation, unload and
remove the specimen. Measure the gage length L (grip to grip
length) of the installed specimen to 0.1 mm.
RESULTS
Plot measured torque, T, versus angular displacement per unit
length,  . Using linear regression, fit
the curve to 30° of relative rotation. (It is assumed that
T is proportional to
  from
from  =0°
to
  = 30°). (Note that
  must be in radians, i.e. p radians
= 180°).
Calculate the shear modulus, G, from the linear portion of the
T- using linear regression to find dT/d
 from
from  =0° to
  = 30°. Compare this value of G to the shear modulus determined
from the tensile test results (i.e.
  ) using
n=0.345 for aluminum.
Using the strength coefficient coefficient, K (or H), and the
strain hardening exponent, n, determined from the tensile test
for the approximate constitutive relation  ,
integrate the predicted shear stress,
  ,
versus radial distance, r, to obtain the predicted torque, T,
after 90° and after 360° of rotation. Compare these
values of T to those measured experimentally. (Note that
  must be in radians for the calculations, i.e. p
radians = 180°). Use the attached "cook book"
method to facilitate your work.
On the same graph, plot shear stress,  ,
and engineering shear strain,
  as functions
of radial distance, r, at 30° of rotation. Construct similar
plots
  and
and  vesus
r for 90° and 360° of rotation. (Note that
  must be in radians for the calculations, i.e. p
radians = 180°).
LAB REPORT
1. As a minimum include the following information in the "Results" section of your report.
a. Raw data (typed in tabular form)
b. Two values for the shear modulus, G (tension and torsion)
c. Two values of the torsional yield stress, to (tension and torsion)
d. "n" and "K" from the tension test (use these in the calculations)
e. Total torque as required in the table:
| Angle of Rotation ................... | |||
| Predicted Torque ( ) | |||
| Measured Torque ( ) . | |||
| % Difference .......................... |
f. Plot of Torque vs. Angular displacement per unit length
(T vs.  )
)
g. One graph each of  and
and  as functions of radial distance, r, for
  = 30_, 90_,
and 360_ (2 plots on each graph
for a total of 3 graphs)

h. Discuss comparisons of basic mechanical properties
as determined from tension and torsion tests. Compare results
of these tests for each alloys to 'book' values from such
sources as the ASM Metals Handbook. Comment on any differences.
Compare the shapes of the stress vs. radial distance curves
and the magnitudes of the plastic and elastic torques.
2. Include the following information in the "Appendix"
of the lab report. THIS MAY NOT BE ALL THAT IS NECESSARY (i.e.,
don't limit yourself to this list.)
a. Original data sheets and/or printouts
b. All supporting calculations. Include sample calculations if using a spread sheet program.
c. All "cookbook" calculations from the Torsion
Test Solution Path.
* REFERENCES
Annual Book or ASTM Standards, American Society for Testing and Materials, Vol. 3.01
E143 Standard Test Methods for Shear Modulus at Room Temperature.
ME343 NOTES on Torsion Testing
TORSION TEST
The initial set of calculations has input parameters obtained
only from the torsion test. The results of these calculations
will later be compared to results calculated with information
obtained from the tension test.
1. Record the torsion specimen diameter (D=2R) and the length
of the gripped section of the torsion specimen, L. Calculate
the polar moment of inertia for a solid rod,  .
.
D = mm
L = mm
J = mm4
2. From the measured torque, T, versus angular rotation,  ,
data points, plot T versus relative angular deflection,
  between two cross sections (i.e.
  ).
Obtain the "best fit" of the linear portion of the T
versus
  data using linear regression.
(It is assumed that T is proportional to
  from
from  =0° to
  = 30°). Determine the slope, dT/d
 from
from  =0° to
  = 30°. (Note that
  must be in radians
for the calculations, i.e. p
radians = 180°).
dT/d = (N-mm)
/ (rad/mm)
3. The shear modulus, G, from the torsion test can now be calculated
from the relation:
 (N/mm2=MPa)
4. Finally, record the measured torques and calculate  for
for  = 90° and 360°. (Note
that
  must be in radians for the calculations,
i.e. p radians = 180°).
T90° = N-mm
 90° = /mm
T360° = N-mm
 360° = /mm
TENSION TEST
This set of calculations has input parameters obtained only from
the tension test. The results of these calculations will later
be compared to results calculated with information obtained from
the torsion test.
1. Record the uniaxial elastic modulus, E, uniaxial yield stress,
 , the strain hardening coefficient, K,
and the strain hardening exponent, n, determined from the tension
test.
E = N/mm2
 = N/mm2
K = N/mm2
n =
2. Calculate the value of the shear modulus from the results of
the tension test:
 using n=0.345
for aluminum.
3. Using the effective stress concept, calculate the shear strength
indicated by the tension test data such that:

and setting  and solving for
  with all other stress equal to zero.
 = N/mm2
EVALUATION OF TORSION TEST RESULTS FOR YIELDING
This set of calculations has input parameters obtained only from
the torsion and tension tests. The results of these calculations
are used to evaluate the shear stresses and shear strains across
the radius of the torsion specimen as it yields.
1. Find the radius of the torsion specimen at yielding, ry
for  = 90° (Note that
  must be in radians for the calculations, i.e. p
radians = 180°).
 where
where 
 mm
mm
2. Within the elastic domain, the shear stress is a linear function of radial distance, r, such that

3. The shear stress as a function of radial distance, r, can now
be multiplied by differential area element,  and a moment arm, r, and integrated to find the torque over the
elastic domain. (i.e.
  ).
).

4. In the plastic domain, only the shear strain remains a linear
function of radial distance, r. Therefore, it is advantageous
to change the integration variable to  .
In order to accomplish this variable change, the shear stress,
 , moment arm, r, and differential area
of integration,
  , must be expressed as
function of
  .
.
In the tension test the uniaxial stress, s,
was expressed as a function of uniaxial strain, e
, through the strenght coefficient, K (or H), strain hardening
exponent, n, such that:

Since the uniaxial stress is identical to the effective stress,
and the uniaxial strain is identical to the effective strain,
the equation relating effective stress to effective strain would
be exactly the same.

When the effective stress and effective strain are evaluated
for the case of pure torsion, the shear stress can be found as
a function of the shear strain.

Since  it is also true that
  and, since
 is a constant .
Substituting these relations into the basic torsion integral
yields:
 for the elastic torque
 for the plastic torque.
Note that the limits of integration are  and
and  . (Note that
  must be in radians for the calculations, i.e. p
radians = 180°).
The total torque, T, is found as the sum of the elastic and plastic
torques such that:
 This torque value is then compared to
the value measured in the torsion test.
For  = 90°, calculated torques are:
Te = N-mm
Tp = N-mm
T = N-mm
For  = 90°, measured torque is:
T90° = N-mm
5. Steps 1 to 4 are repeated for  = 360°
(Note that
  must be in radians for the
calculations, i.e. p radians
= 180°).
For  = 360°, calculated torques are:
Te = N-mm
Tp = N-mm
T = N-mm
For  = 360°, measured torque is:
T360°°= N-mm
6. Finally, plot  and
and  as functions of r after
  = 30° for
relative rotations of
  = 90° and
 = 360°. (Note that
  must be in radians for the calculations, i.e. p
radians = 180°).
STRESSES IN THE ELASTIC RANGE
In the elastic range, stresses in the shaft will remain less than the proportional limit and less than the elastic limit as well. For this case Hooke's law will apply and there will be no permanent deformation. Hooke's Law for shear stress is as follows:


G = Modulus of rigidity (shear modulus)
 = Shear Stress
 = Shear Strain
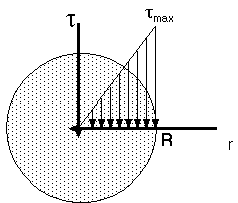
The elementary forces exerted on any cross section of the shaft
must be equal to the magnitude T of the torque exerted on the
shaft:


The last two equations are known as the elastic torsion formulas.
ANGLE OF TWIST IN THE ELASTIC RANGE
For this section the entire shaft will again be assumed to be in the elastic range. Therefore Hooke's Law applies.
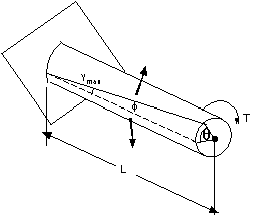
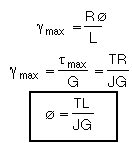
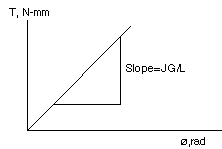
The angle of twist, Ø, is expressed in radians. The angle of twist is proportional to the torque T applied to the shaft. The above equation provides a convenient method for determining the modulus of rigidity, G. Torques of increasing magnitude T are applied to the specimen, and the corresponding values of the angle of twist in a length L of the specimen are recorded. As long as the yield stress of the material is not exceeded, the points obtained by plotting Ø against T will fall on a straight line. The slope of the line represents the quantity JG/L from which the modulus of rigidity, G, may be computed.
PLASTIC DEFORMATIONS IN CIRCULAR SHAFTS
If the yield strength is exceeded in some portion of the shaft the relations discussed in the earlier sections cease to be valid. The purpose of this section is to develop a more general method for determining the distribution of stresses in the solid circular shaft, and for computing the torque required to produce a given load.
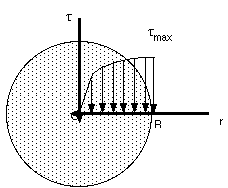
As the torque increases, tmax eventually reaches the shearing yield stress, ty, of the material. Solving for the corresponding value of T, we obtain the value of Ty at the onset of yield:

Ty is referred to as the maximum elastic torque, since it is the greatest torque for which deformation remains fully elastic. Recalling that, for a solid circular shaft, J/R=1/2 (¹R3) we have:

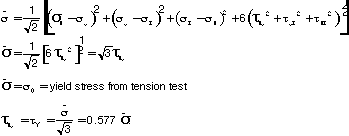
The  can be found using the data from
the tension test and the idea of effective stress. Using
the Distoritonal Energy (von Mises) criterion and the yield stress
from the tensile test lab
  can be determined.

The total torque is a function of the torque in the elastic range and the torque in the plastic range.


