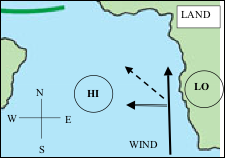
1. Fig. 1
depicts the coastline of S. Africa in the South Atlantic Ocean, with wind
direction indicated by the thick arrow.
Given the wind direction, draw and label where the high (H) and low (L)
pressure centers are located.
(Note: you should be able to draw one pressure center over land and one
over the ocean.)
2. Use a dashed arrow to show the direction of currents at the surface according to the idealized Ekman spiral concept.
3. Show the direction of net transport in the Ekman layer using a double arrowI.
Figure
1 Figure
2
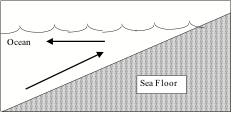
4. Fig. 2 is a cross-sectional profile of the sea floor and overlying ocean along the coast depicted in Fig. 1. Draw arrows indicating the horizontal & vertical directions of water motion.
5. This coastline provides an
example of (circle one) upwelling downwelling
Figure
3a Figure
3b
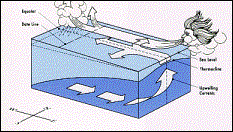
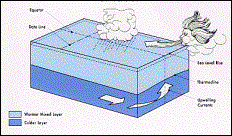
Figures 3a
& 3b <http://winds.jpl.nasa.gov/aboutScat/el_nino.cfm>
represent conditions in the equatorial Pacific during “normal” and “El Niño”
conditions.
6. Which diagram
represents “El Niño” conditions (circle one)? 3a 3b
7. Briefly describe 4 differences
between “normal” and “El Niño” conditions that are depicted in Figures 3a &
3b. _Niño in the eastern Tropical Pacific: less upwelling, lower nutrient
supply, warmer surface temp, deeper thermocline, weaker (sometimes reversed)
trade winds, atmospheric convection moves
east, more precipitation, weak
equatorial current