![]()
The following five sections contain information about basic mathematical operations and rules that are commonly assumed in introductory statistics and methodology courses. These five sections are by no means a complete review of the math concepts you will need to understand, but they do cover the areas most commonly encountered in quantitative courses at the undergraduate level.
1. Order of operations in mathematical statements
Consider the mathematical expression:
Work out the expression for yourself. Answer ______
In order to determine the numerical value of this expression, you must carry out a number of arithmetic operations, and they must be carried out in a specific order.
Check your answer by clicking here.
Is your answer 1? If it is, your answer is correct. You should have arrived
at this answer by carrying out the following arithmetic operations in the order
given:
1. Perform all operations within parenthesis first.
2 + 4 = 6
2. Squaring or raising to any other power is done second.
3. Multiplying and dividing is done last.
36 divided by 36 is 1.
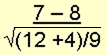
Let's try another:
The correct answer is -¾ or -.75. You will obtain this answer by carrying our the following operations:
1. Perform any operations
within parenthesis first.
12 + 4 = 16
2. Squaring or raising to any other
power is done second.
The square root of 16/9 is 4/3.
3. Multiplying and
dividing is done third.
-1 divided by 4/3 is ¾.
The key to performing the
operations in the correct order is to pay particular attention to parentheses if
there are any. ALWAYS CARRY OUT OPERATIONS WITHIN PARENTHESES
FIRST.
Remember, the proper order of operations is critical to getting
the right answer.
2. Fractions, decimals, and percentages
Any number expressed as a fraction can be interpreted as a proportion. For example the fraction 3/8 can be interpreted as "3 out of 8." This proportion, or fraction, can also be expressed as a decimal: 3/8 is equal to .375. To convert a fraction to a decimal, simply divide the numerator by the denominator. Finally, any decimal or fraction can be expressed as a percentage. To express a decimal as a percentage, simply multiply the decimal by 100 and place a percent sign (%) after the answer: .375 x 100 = 37.5%.
For practice, write out the
fraction and compute the decimal and percentage for the following three
proportions:
1. 8 out of 10
2. 45 out of 50
3. 2 out of 3
ANSWERS:
1. 8/10, .8,
80%
2. 45/50 (which reduces to 9/10). .9, 90%
3. 2/3, .667,
66.7%
To raise a fraction to a power,
you must raise both the numerator and the denominator to that power.
For example,
You may also perform the division within the parenthesis first, and then raise your answer to the power of 2.
Either approach will yield the correct answer, but it may be easiest to simply remember the parenthesis rule: ALWAYS CARRY OUT OPERATIONS WITHIN PARENTHESES FIRST. With exponents, the rule becomes: If an expression within parenthesis is raised to a power, you must first carry out any operations within the parenthesis.
Of course, if an expression contains elements raised to a power individually, you must carry out the power operations first.
For example:
IMPORTANT: Notice that
.
In fact, ![]()
REMEMBER: ![]()
4. The equation of a straight line
The standard form for the equation of a straight line differs from textbook to textbook, but the general form is always the same. The general form states that a y value for any point on a straight line can always be determined by taking the product of its corresponding x value and the slope of the line and then adding the y-intercept:
y = slope x + intercept
What students often find confusing is the array of letters used to represent the slope and intercept. In statistics courses, the most commonly used letters are a for the intercept and b for the slope. Thus, the equation you will most often encounter will be in the form:
y = bx + a
If you are given values for the slope and intercept, you can readily write out the equation of the line. For example, if you are told that the slope is 4 and the y-intercept is 2, then the equation for that line is: y = 4x + 2.
How do you determine the equation of the line if you are NOT given the slope and intercept? You must be given two points that are on the line in order to determine the equation of that line. If you know two points on the line, you can easily determine the slope of the line by using the equation:
For example, if you know that the points (14, 2) and (4, 1) are on on the line, then the slope of that line is (2 - 1)/(14 - 4) = 1/10 = .10.
An easy way to obtain the y-intercept is to substitute ONE of the points and the value of the slope into the slope equation.
Working this equation into the general form yields:
y = .1 x + .6
From this equation one can see that the slope of the line is .1 and the y-intercept is .6.
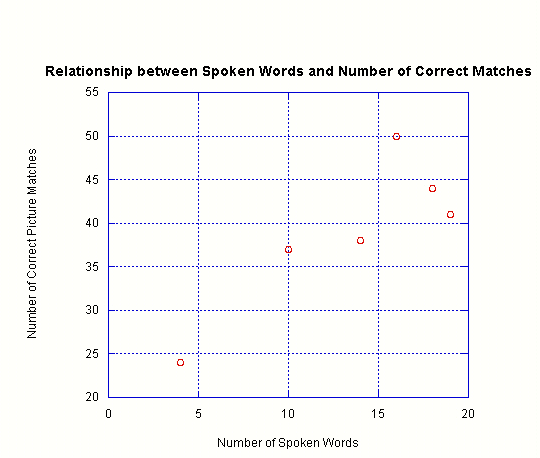
Often in psychological studies information comes in pairs. This is because it is common to obtain multiple measurements from participants in a study. For example, one might be interested in the number of spoken words in a 14 month old's vocabulary and the number of pictures he or she can correctly match with a spoken word. ("Show me the BOAT.") In this case, each participant provides two bits of data: (1) the number of spoken words and (2) the number of correct matches. It is customary to label one of the variables (X) and the other (Y). We must choose which variable will be labeled X and which will be labeled Y. This is often an arbitrary decision, but usually if one variable is used in some way to predict the other, the predicted variable is labeled Y and is placed on the y-axis. Let's call the number of spoken words "X" and the number of correct matches "Y."
In order to explore the relationship between the two variables, a 2-dimensional scatterplot can be used to create a graphical representation. Of course more than one participant's scores will be plotted in this space. Suppose that you have the following data:
|
Spoken |
Correct
ID | |
|
Toddler |
X |
Y |
|
1 |
18 |
44 |
|
2 |
16 |
50 |
|
3 |
10 |
37 |
|
4 |
4 |
24 |
|
5 |
14 |
38 |
|
6 |
19 |
41 |
These data can be
plotted in a scatterplot. We'll place the number of spoken words on the x-axis
and the number of pictures correctly identified on the y-axis.