Tutorial 3.1 - GIS / Basic Mapping
This tutorial consists of three parts. In this tutorial you will use queries, theme modification, and overlay functions (some optional raster analysis) to select a site for a new fire station.
Tutorial 3.1 - Part 1
In Part 1, you will begin the process by performing some queries and theme modification to assist you in visually identifying suitable sites. The criteria for a suitable site (for now) is based on the following four criteria:
- What parcels are currently vacant?
- What parcels are in areas zoned for commercial use?
- What parcels are not covered by water?
- What parcels are not occupied by parks?
A. SETTING UP YOUR PROJECT
- The data you will be using in this exercise comes from the Washington State Geospatial Data Archive (WAGDA). Open the web site by clicking on the following link: http://wagda.lib.washington.edu.
- At the WAGDA web site, click on Download Data Online, then on the quick link to City data. Scroll to the bottom of the page and click on the City of Seattle link (you'll need to enter your UW NetID at this stage and agree to the Data Use Policy). This brings you to the main page for downloading City of Seattle geospatial data.
- Download the following four files to your working directory:
- Under the subheading Community Services, download:
- Fire Districts (fire.zip)
- Under the subheading Administrative / City Boundaries, download:
- Shoreline (polygons) (SHORELIN.zip)
- Under the subheading Propoery and Survey, download:
- Parcel Boundaries Delineated by King County (parcel.zip)
- Under the subheading Terrain, download:
- Parklands & Green Space (park.zip)
- Under the subheading Property and Survey, download:
- Zoning (zoning.zip)
- Zoning (zoning.zip)
- Under the subheading Community Services, download:
- Open ArcMap, then add all five datasets in a blank map.
- Look at the zoning codes in the Table of Contents in the layer zoning. Compare the zoning codes there to those listed in the City of Seattle's Munipal Code by clicking here.
B. SELECTING VACANT PARCELS
Your unit of analysis is a parcel. By this, I mean that ultimately the real estate division of the Seattle Fire Department is looking for a parcel or a set of adjacent parcels to purchase and develop into a fire station. So in our first step, we will find the vacant parcels.
- First, right-click on the Parcel layer's name and choose Open Attribute Table to view what attributes might help us find the vacant parcels.
- In the Selection menu, select Select By Attributes....
- In the query window, select the parcel layer and choose to create a new selection, then click Next.
- Next, you will be querying for parcels whose PRES_USE_D contains the string "Vacant". To do this, you'll need to select the operator Like, and you'll need to use a wildcard character in the last box. The wildcard character % represents a string of any length, so searching for the string %Vacant% will search for any string that has the word "Vacant" somewhere within it. Click Next, then click Finish.
- in the Select By Attributes box, you'll have to set a new query statement as the one shown above.
To execute the query, click Apply. When the query is done, click Close.
- Now, right-click on the Parcel layer's name and choose Data>Export Data.... You should see the dialog box shown below:
Set Export to Selected features and export them to a new dataset in your own directory named something like "VacantParcels.shp", then click OK. This will create a new shapefile that contains only the parcels that you selected in the query.
- When you are asked whether to add the new layer to your project, click Yes.
- Then disselect features by going to Select menu > Clear Selected Features
- To see only the vacant parcels, turn off the layer of all parcels by unchecking its box in the Table of Contents.
- Adjust the symbology for Vacant Parcels as you see fit.
C. SELECTING COMMERCIAL ZONES
Next you will select commercially-zoned areas and dissolve them to make them easier to use in visually identifying suitable locations.
- Use the same process as above to select Zoning areas that have a ZONELUT that contains the letter "C". This will select all areas that have either a commercial zoning or a mixed residential/commercial zoning.
- After you have selected the commercial areas, export them to a new dataset in your own directory named something like "CommercialZones.shp".
- Next you will dissolve the commercial zones to a single multi-part shape for each specific zoning code. click ArcTools icon,
 .
.
- Select Dissolve under Data Management Tools then Generalization
- Set the drop-down box in Input Features to CommZones, check ZONELUT as Dissolve_Field, and give your output shapefile a name such as "CommZonesDissolved.shp". Click OK.
- Double-click on the symbol for your Commercial Zones to modify it. Change it to one of the pre-set patterns that has "hatching", or diagonal lines, on it, such as "10% Simple Hatch".
- Now that you have a dissolved layer of commercial zones, you don't need to see the other zoning layers. In the Table of Contents, uncheck the boxes next to both Zoning and CommZones, but leave checkbox checked next to CommZonesDissolved.
D. SELECTING WATERBODY
Now you need to will create a waterbody layer from SHORELIN layer.
1. To have a layer only contains waterbody, click Selection menu then Select by Attributes, In the dialog window set your query as shown below
2. Then right-click on the SHORELIN layer's name and choose Data>Export Data to create a WATERBODY layer that only has all the waterbody
E. ADJUSTING YOUR VIEW
In the last step, adjust the order of your layers so that you can see all of the relevant information.
- You may notice that there are some vacant parcels that are located off some of the shorelines, especially around Discovery Park, the point located near the west end of the Ship Canal. To hide these, move both your Commercial Zones Dissolved and your Vacant Parcels layers below your waterbody layer.
- Also note that some of the commercial zones are actually parks, such as along the Burke-Gilman bicycle trail to the northeast of the University of Washington campus. But for our purposes, parks are not suitable locatiosn for a new fire station. To hide these areas, move the Parks layer above both the Commercial Zones Dissolved and the Vacant Parcels layers.
- Even though parks are off-limits, we might still be interested in what zoning and vacant lots are within them. To see them at the same time, we can make the Parks layer semi-transparent. To do this, go into the View menu and select Toolbars>Effects. You'll see a new toolbar that looks like this:
In this toolbar, set the Layer to park, then click on the button at the far right-end that looks like a pitcher half-full of blue water. You should now see a slider control that looks like this: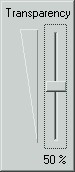
Using your mouse, drag the slider until the gauge says "50%", then let go of the mouse button. The parks layer should now be half transparent to the layers underneath it. You may want to also change the Transparency for Parcel layer.
- Your last task is to cruise around the map using your navigation tools to search for areas of the city that seem (by visual observation only) to be the most underserved in terms of fire station proximity. For these areas, are there vacant lots that are commercially-zoned and are not within parks, where we might want to place a fire station?
Tutorial 3.1 - Part 2
In Part 1, you used visual inspection to qualitatively evaluate potential sites for the new fire station. Now, in Part 2, you will use a more methodical approach, using overlay functions to explicitly identify the locations that meet the criteria. Remember, the criteria for a suitable site are:
- Parcels must be vacant.
- Zoning must be for some type of commercial use.
- The site cannot be covered by water.
- The site cannot be covered by parkland.
A. OVERLAY FEATURES
We start by creating a flowchart showing the datasets and operations we intend to perform:
In the first stage of this flowchart, you will perform an ERASE operation on the vacantparcels layer to eliminate from consideration all areas that fall within lands. The ERASE operation takes the full extent of one layer and uses it to erase parts of another layer. Taking the erase of Waterbody layer from VacantParcels layer as the example, this means that all waterbody polygons, regardless of their attributes, will be used as erasers of the vacantparcels polygons.
- Open ArcToolbox .
- Find the tool Analysis Tools > Overlay > Erase and double-click it.
- You will see the following dialog box:
Enter the Input Features and the Erase Features as shown above , leave the Cluster tolerance empty, and give your Output Feature class a name (e.g. vaclandparc). Make sure to place this new Feature layer within your own subdirectory ,
- Click OK to perform the ERASE.
- Next, perform another ERASE operation, this time starting with the water-less layer you just created in the step 4 (as the Input features) and using the parks layer as the Erase Features . Use Steps 2-5 above as a guide.
- After finishing your second ERASE operation, you should have a layer that represents all of the vacant parcels that are not in water and not in parks. You will now intersect that layer with the Commercial Zoning (commzonediss) Layer. This will produce a new geography that combines the boundaries of both input Layers but includes only areas that are shared by both Layers.
- In ArcToolbox, find and double-click on the tool Analysis Tools > Overlay > Intersect.
- You will see the dialog box shown below:
Under Input Features, enter the layer you produced in Step 6 after your second ERASE operation and the CommZone_Dis layer from Part 1. give your Output Feature Class a name, and set ALL forJoin attributes.
- Click OK to begin the INTERSECT operation.
- You have now created a polygon layer that represents every discrete area in Seattle that has a unique parcel identity, a unique zoning designation, and meets the conditions of not being in water and not being in a park..
B. SELECTING SITES BY SIZE
- The last step in selecting a location is to be sure the site is large enough to accommodate a fire station. The data you are using is in feet. Let's assume we need a site that has at least 10,000 square feet of area. Query the layer you just created to find all parcels whose AREA is greater than or equal to 10000, then export those parcels to one last layer. You may need to refer back to the instructions for Part 1 to get started (something about "Select by Attributes")..
- Set the symbology of your final layer to something rather noticeable at a city-wide scale.
In Part 3, you will conclude this process by using some raster calculations to prioritize the suitable locations, thereby finding the best location.
Tutorial 3.1 - Part 3
In Part 2, you used GIS functions to methodically determine what sites would be suitable for a fire station, based on some minimum criteria. In Part 3, you will prioritize these potential locations based on current service needs, as reflected by the distances to the nearest fire station across Seattle.
A. SETTING UP YOUR PROJECT
- Open your ArcMap project file from Part 2.
- Add to your project the following layer WAGDA:
- Under the subheading Administratice / City Boundaries, download:
- Municipal Boundaries (munibond.zip)
- move this layer to second-to-top in your Table of Contents, just underneath the Fire Layer
- Under the subheading Administratice / City Boundaries, download:
- Make sure the Spatial Analyst extension is activated: in the Tools menu, select Extensions.... In the list, make sure that there is a check-mark in the box next to Spatial Analyst, then click Close.
- Make sure the Spatial Analyst toolbar is showing. If it isn't, then go into the View menu and select Toolbars > Spatial Analyst.
- Some option we need to change are the analysis mask and the extent for new raster layers. When we start creating raster layers, ArcMap doesn't initially know how far we want our calculations to go, so we need to specify that. We also need to specify that we only want values calculated for areas within the city limits; cells outside the city limits but within the extents of the rectangular-shaped raster layer will have "null" or "NoData" values.
In the Spatial Analyst toolbar, open the Spatial Analyst menu and select Options.... Under the General tab, set your working directory and set the Analysis Mask to "munibond" .
- Under the Extent tab, change Analysis Extent to Same as Layer "munibond".
- Click OK to save these options.
The flowchart below summarizes all of the steps you will be taking in this exercise:
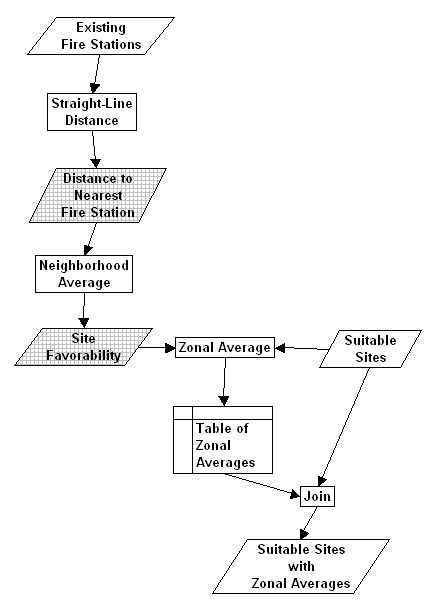
B. PROXIMITY TO FIRE STATIONS
The first step is to create a raster file representing the distance to the nearest fire station for every location in Seattle. Since we're talking about every location, what we really mean is a continuous surface where higher values indicate that the nearest fire station is far away, and lower values indicate that the nearest station is quite close. And of course, since we want a continuous surface, we decide to create a raster layer.
- In the Spatial Analyst menu, select Distance > Straight Line. You should see the following dialog box:
Set the Distance to layer to Fire (firestations) , set the Output cell size to 660 (i.e. 1/8 mile), and give your Output raster a name. Be sure to save it in your own folder.
- Click OK to create the new raster layer.
- The new layer will be automatically added to your ArcMap project. Note that you see distinct bands surrounding each fire station. These bands each represent a discrete range of values for "distance to nearest fire station", but remember that the data embedded in the raster file is continuous, not discrete. The discrete bands are simply due to the default symbology settings.
C. GENERALIZING THE PROXIMITY DATA
What we know now is the fire-station-distance data for every discrete location in Seattle. However, it might be a bit extreme to simply pick a location that has the highest distance-value in the City, because there may be a huge cluster of rather high distance values somewhere else. So what we really want is sort of a "moving average" of fire-station-distance that takes into account not only what's going on at a specific location, but what's going on in the general vicinity of each location. For that, we use a "neighborhood function" that averages the fire-station-distances for all cells within a moving window centered on each cell. We can then interpret this as the favorability of a potential site for the new fire station, since we would like a site in a neighborhood that is underserved - i.e. has high distances to the nearest fire station.
- In the Spatial Analyst menu, select Neighborhood Statistics.... You should see the following dialog box:
Enter the values shown in the image above, except give the Output raster a name and location in your own folder .
- Click OK to create the neighborhood-average distance-to-fire station raster file.
- The new layer will be automatically added to your project. The color scheme will vary, but you should see bands of color that generally wrap around the fire stations, especially those that are clustered together. The Table of Contents will tell you which colors indicate high and low values for neighborhood-distance-to-fire-stations.
D. ASSOCIATING FAVORABILITY DATA WITH THE SUITABLE SITES
In the last step, you will merge your raster layer of neighborhood-distance-to-fire-station into your vector layer of suitable sites.
Now, to integrate the raster data into the Suitable Parcels layer, we will use a "zonal function", where all raster cells within a given polygon are averaged.
- To get started, go into the Spatial Analyst menu and select Zonal Statistics.... You should see the following dialog box:
Enter the values shown in the image above, except give the Output table a name and location in your own folder.
- Click OK to compute the suitable-parcel-zone averages of the neighborhood-average-distance-to-fire-station variable.
- When it's done, you should see two things pop up:
- A table summarizing the zonal stats (including average, max, min, etc.) for all suitable parcels, and
- A chart summarizing the zonal averages for suitable parcels.
- Close the graph and the chart, then look back at your map.
- Right-click on the name of your layer of Suitable Parcels (VacantParcelPark_Inter), then select Open Attribute Table.
- Find the field name polygon:FID_Vacant, then scroll down until you see the unique identifier that you wrote down in Step 4 above. Select that row in the table (by clicking on the most-left cell in this row), then close the attribute table.
- Your selected parcel should now appear on your map of Seattle as a small polygon outlined with a thick light-blue line.
Last modified: 4/29/2009 12:18 PM