 |
|||||||||||||||
| |Main| |Intro| |Methods| |Results & Discussion| |Data Repository| | |||||||||||||||
CTD ResultsTemperature: CTD Profiles
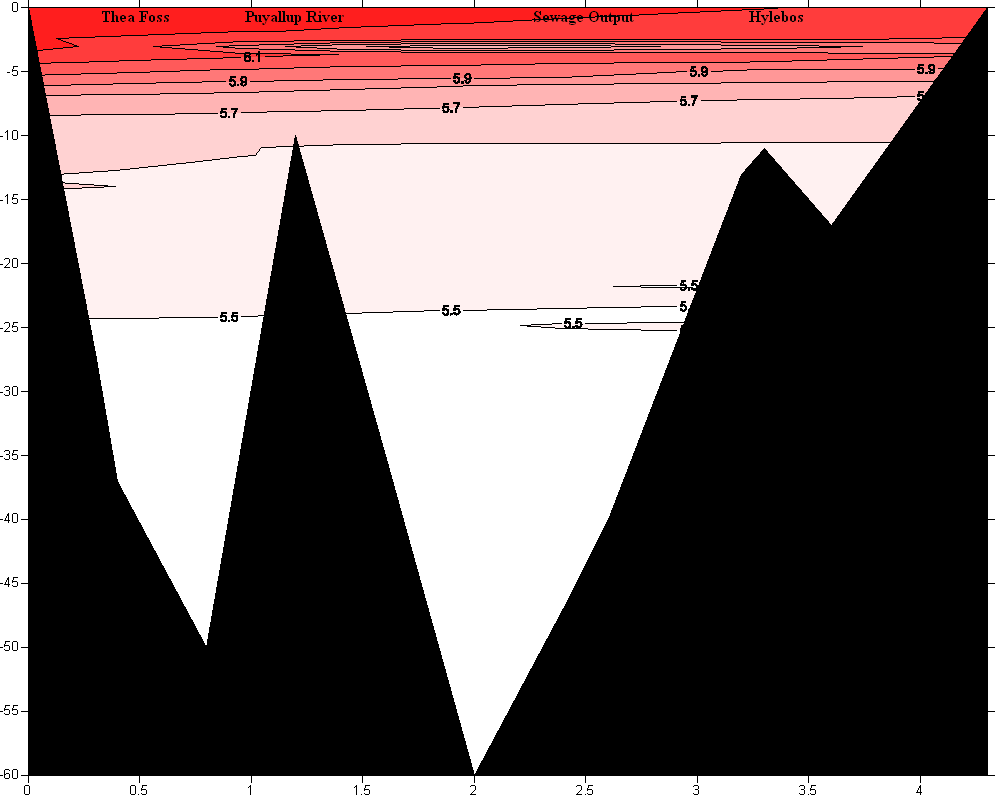
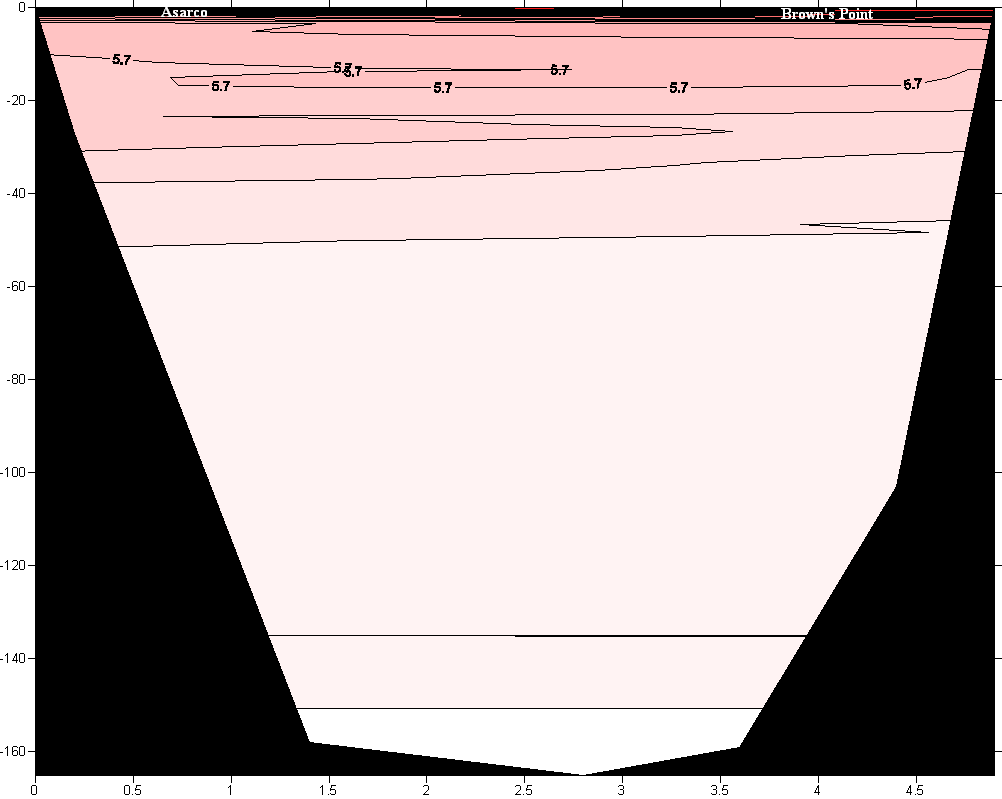
Salinity: CTD Profiles
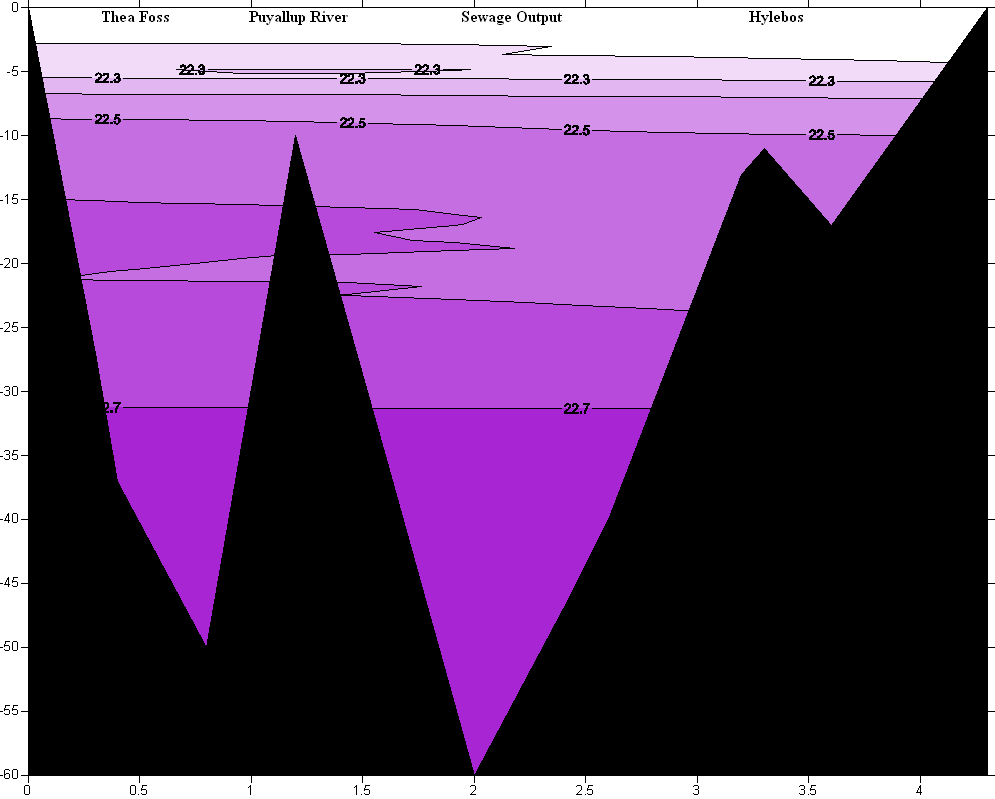
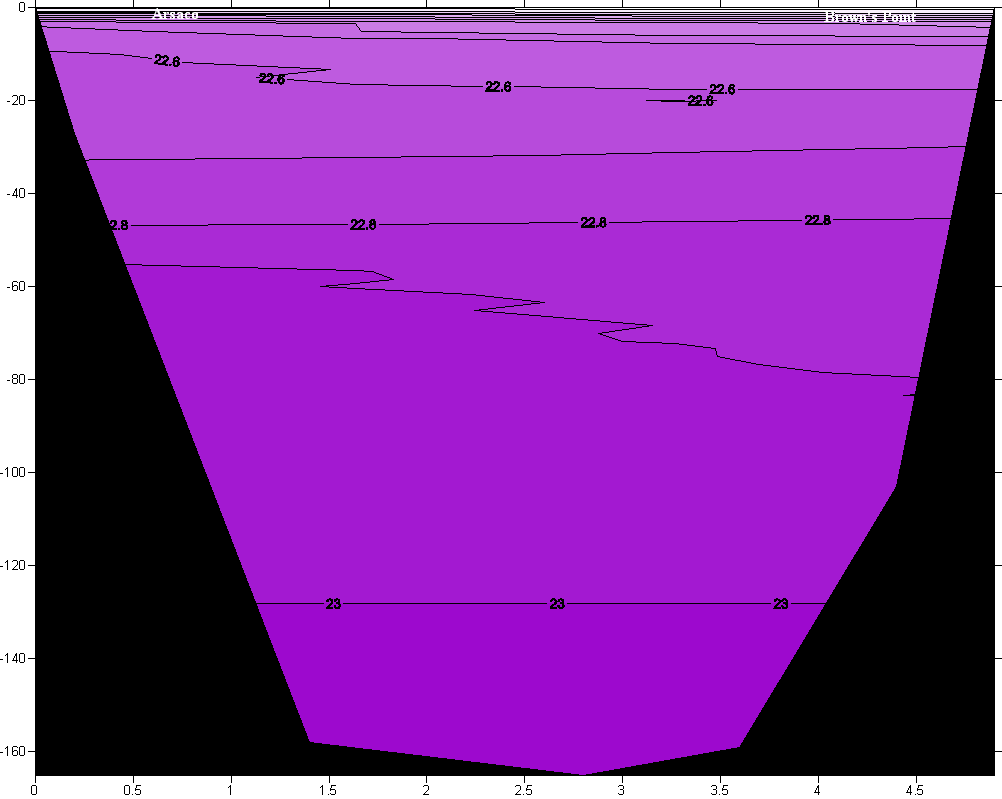
Density: CTD Profiles
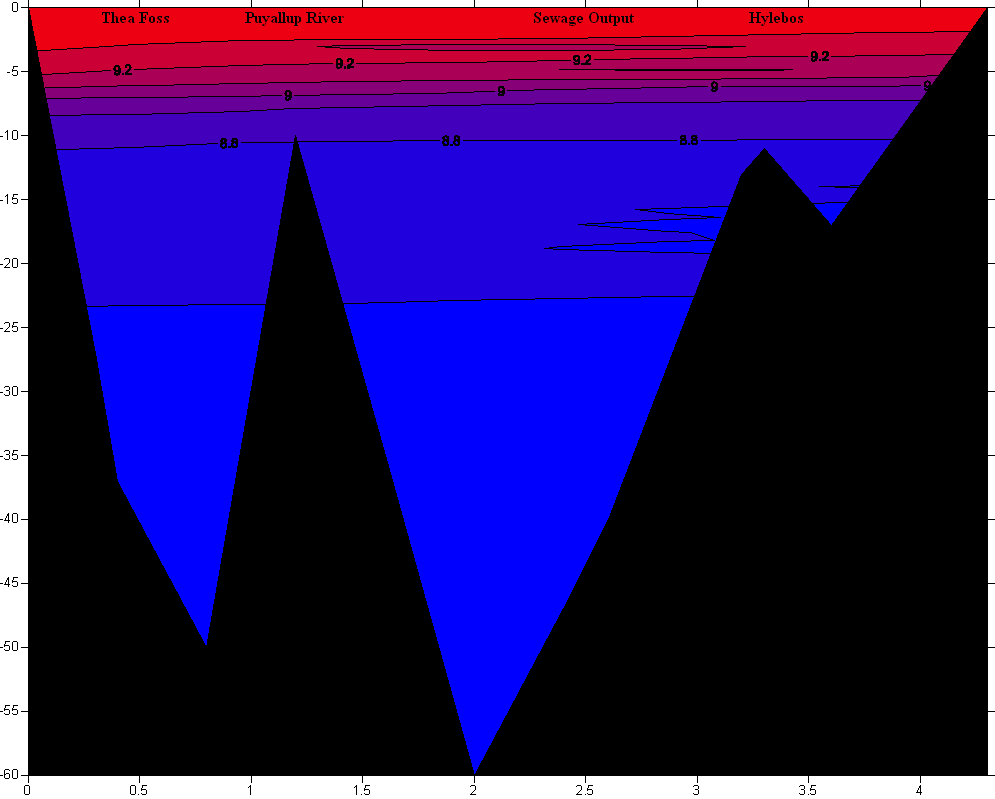
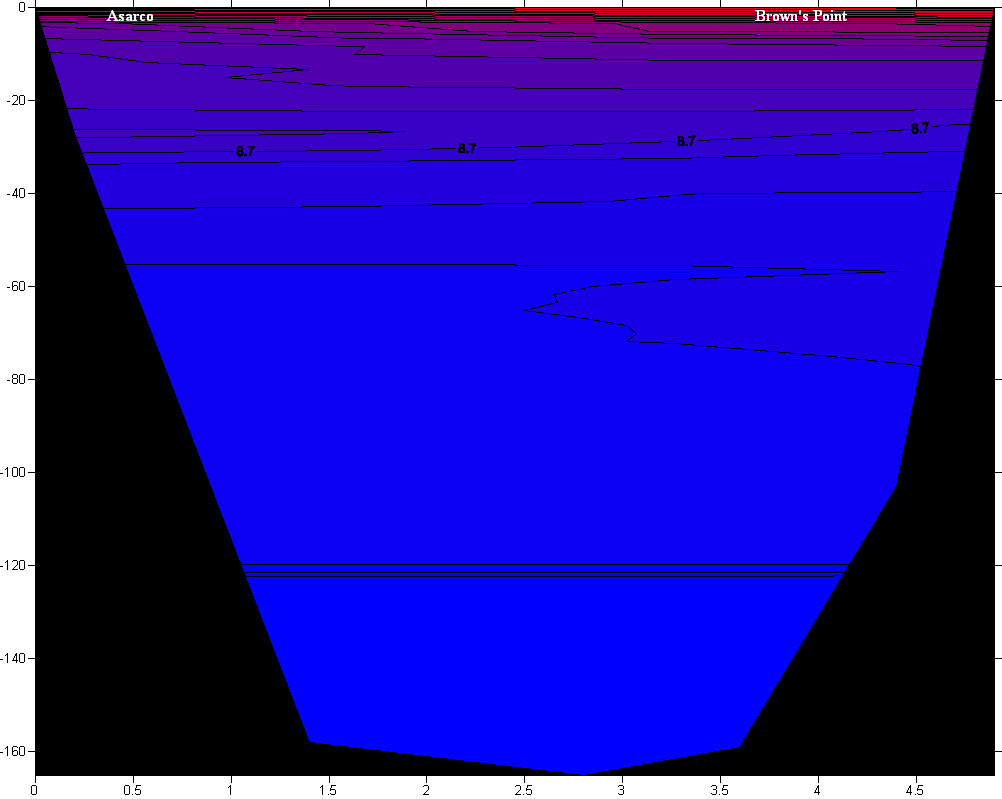
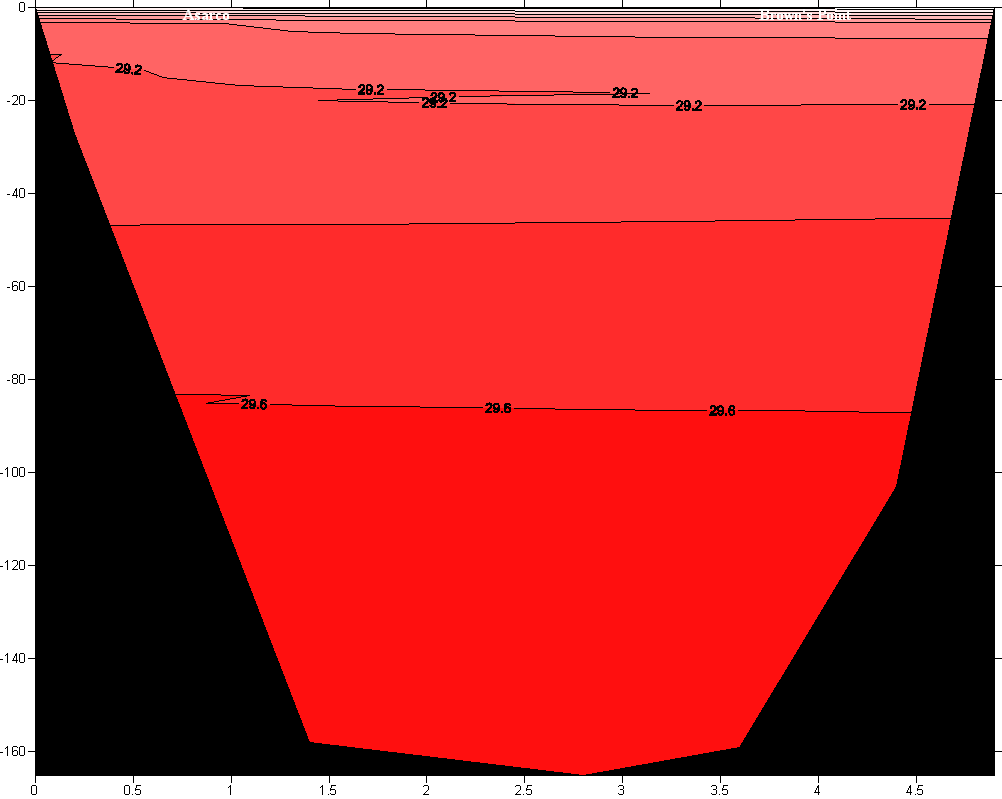
Temperature, Salinity, and Density: The following graphs show that as depth increases, temperature decreases while the density and salinity increases. The differences of the aforementioned parameters from the surface and the bottom were relatively small. The graphs showed that the differences were about 1-2 units. The small differences in the measured parameters indicate a well-mixed water column in the Commencement Bay. The collected data also confirms the bathymetry of the Commencement Bay. This bathymetry was taught to our estuaries class first hand with the use of the Puget Sound model at University of Washington in Seattle. The flat estuary floor creates a salt wedge in which there is two layer patterns of salt and fresh water. However, when there is some sort of bathymetry the water is very well mixed due to the circulation of water going through the “hills” or sills on the bottom floor. Dissolved Oxygen: CTD Profiles Comparison of CTD and Bottle
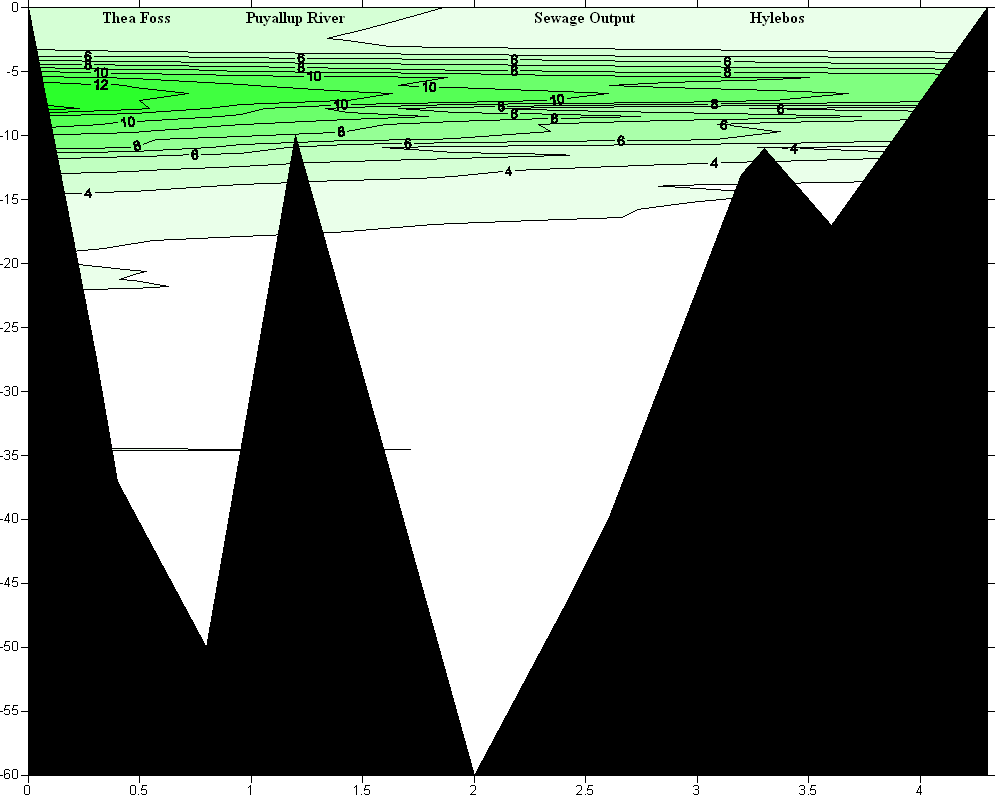
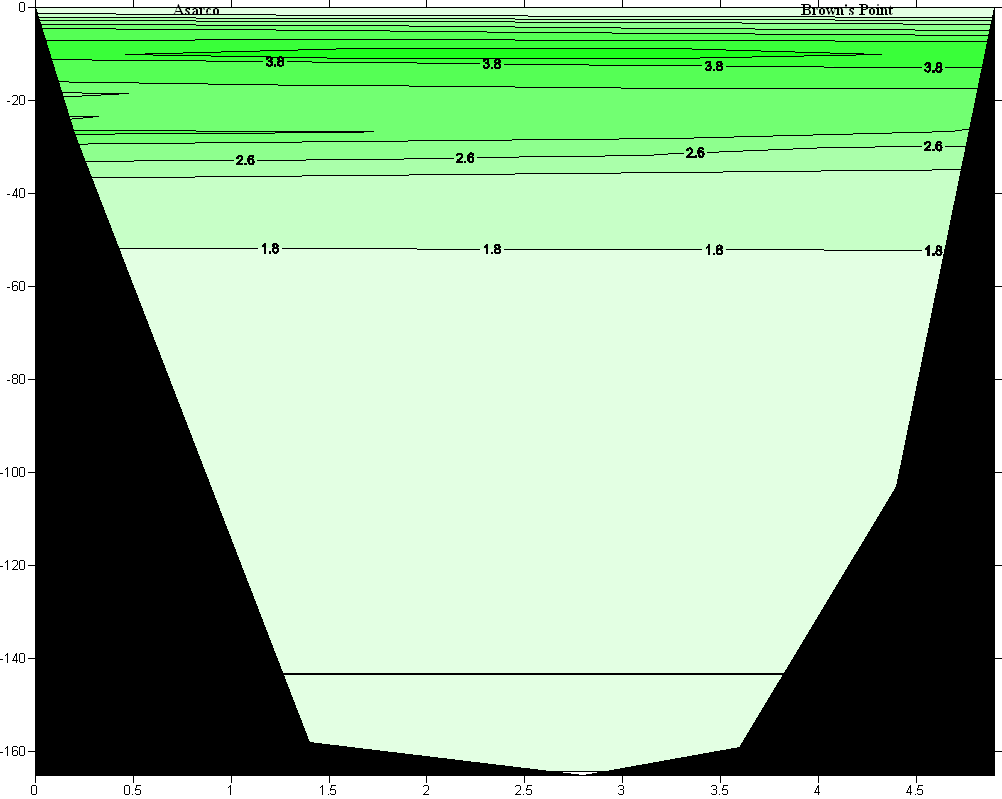
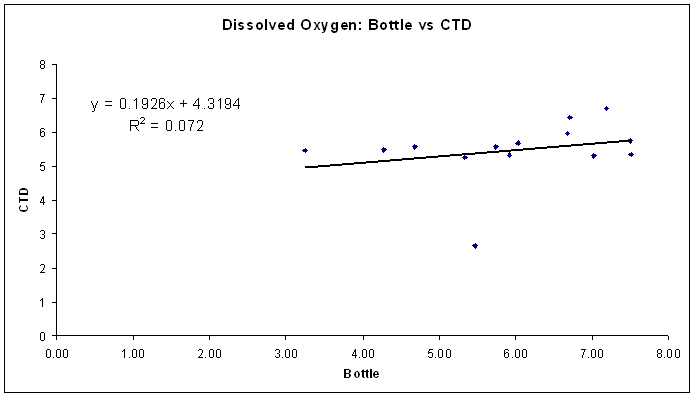
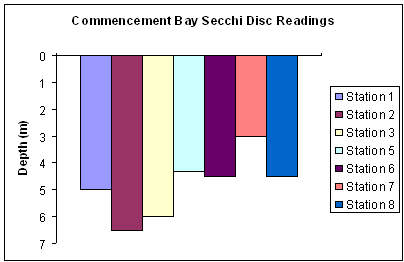
Guideline for Interpretation of Dissolved Oxygen Readings: 0-2 mg/L: not enough oxygen to support life 2-4 mg/L: only a few kinds of fish and insects can survive 4-7 mg/L: acceptable for warm water fish 7-11 mg/L: very good for most stream fish including cold water fish For percent saturation: 0- 60% Saturation : poor; water too warm or bacteria using up DO 60-79% Saturation: acceptable for most aquatic organisms 80-125% Saturation: excellent for most aquatic organisms (Annis Water Research Institute, 2005) Oxygen is the highest from the surface to 5 meters because of proximity to air and climate; this is shown in both the inner and outer stations. Phytoplankton blooms will also give influence because they give off oxygen as a byproduct of photosynthesis. Oxygen is a key component to water quality and also a determinate in the survival of all organisms. The reason that our oxygen titrations came out so poorly is because it was our first time in lab. Chlorophyll: CTD Profiles Comparison of CTD and Bottle Secchi Disk Reading
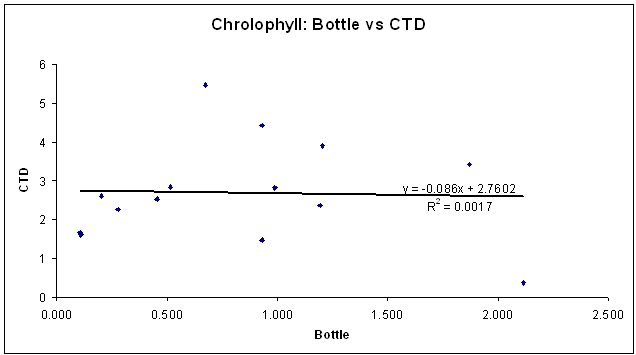
In the case of Commencement Bay there is a small thermocline, this is an environment where the warm surface water comes in contact with the cooler deeper water. The previously mentioned thermocline makes a well-mixed column and creates opportunity for high areas of primary productivity. The reason the water is mixed so well is because there is an abundance of mixing from the surface winds and all of the bathymetry that makes up the bay, hills, sills, eddies, etc. Chlorophyll data represents the amount of primary productivity that there is in the water. There was a large difference between the chlorophyll data and the CTD data, because there are so many different transfers from centrifuge tube, to sonicator, and later to be analyzed, whereas the CTD measures it once is calibrated before use and is more accurate. The reason that our chlorophyll results came out so poorly is because it was our first time in lab. Transmission: CTD Profiles
The transmissometer measures particles moving past and around it. There are higher readings near the bottom in most stations because the bottom currents are moving soils and sediments around and decreasing visibility. The highest readings were found near the Puyallup River due to the fact that it is a high energy area and the largest freshwater input into Commencement Bay. Phytoplankton and Zooplankton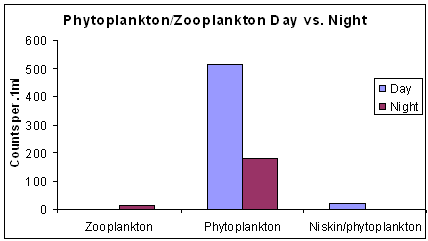
The plankton samples show that at night there is more phytoplankton on the surface of the water than zooplankton in the vertical water column. The result is expected because we collected the plankton in the early spring. Normally the phytoplankton bloom will occur first then the zooplankton because the phytoplankton are available as a food source. The results of the daytime plankton sample were just the opposite of the zooplankton count. During the day, more phytoplankton are present on the surface because of the availability of sunlight and the lack of predators (zooplankton). There is no evidence of zooplankton at daytime because during this time they were in deeper water column avoiding predation. The reason the numbers of phytoplankton are more abundant at night vs. day is because the sample at night was collected in a larger water column. The results from the Niskin bottle sample confirm this. There is more plankton found at day than at night in the sample of 2.5 L of surface water collected by the Niskin bottle. Sediment Analysis 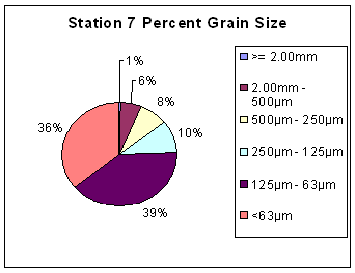 The sediment grain size analysis indicates that
the sediment at station 2 has larger particles than at station 7. The result of
this analysis confirms that there is more vigorous mixing at station 7 than at
station 2. The reason for the difference in sediment size is because the silt
from the Puyallup River (Station 2) is deposited off of its mouth. Station 7
is out in the bay, a calmer area and allows for larger particles of sediment to
settle to the bottom.
The sediment grain size analysis indicates that
the sediment at station 2 has larger particles than at station 7. The result of
this analysis confirms that there is more vigorous mixing at station 7 than at
station 2. The reason for the difference in sediment size is because the silt
from the Puyallup River (Station 2) is deposited off of its mouth. Station 7
is out in the bay, a calmer area and allows for larger particles of sediment to
settle to the bottom.Conclusion:When comparing to the 2005 results of Commencement Bay the salinity and temperature graphs are very similar. Temperatures in both 2005 and 2006 vary from 8.5 to 10.5 degrees Celsius. Salinity averages about 28 parts per thousand (ppt) in both years. The oxygen is once again comparable with an average of the two years observed in the upper most water column and an average of 5.9ml/l. Commencement Bay has the City of Tacoma in close proximity, millions of gallons of groundwater, the decommissioned Asarco copper smelter, the Puyallup River, and a major sewage treatment plant dumping processed effluent into its estuary. These are merely a few possible problematic issues that we need to be aware of. If we aid in the proper precautions hopefully as a community we will ensure a healthy estuary in the bay for future generations. |
|||||||||||||||
