|
|
|
|
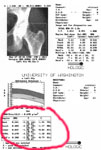
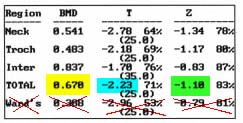 | Hologic Hip. I think the most important region of interest is the total hip, because it is the most representative and contains both cortical and trabecular bone. Highlighted in yellow is the density in grams per square centimeter; in aqua is the T-score, and in lime is the Z-score.
It is worth checking that the neck, trochanteric, and intertrochanteric values are within 1/2 standard deviation from the total hip. Large discrepancies could mean technical error, or a maldistribution of cortical/trabecular bone. Old studies looked at the femoral neck, which generally gives the same fracture prediction as the total hip. Some people advocate using the lowest region to predict fractures; this approach has never been validated in a prospective study with fracture as the endpoint. The Ward's "square" is not reproducible and is seldom in the same anatomic position from scan to scan. |
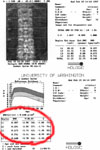
 | Hologic Spine. The L1-4 region is the most important. Again, the values for each vertebra should be reasonably close to each other. A large discrepancy could be a technical problem or could represent bone pathology. A small point: Don't confuse the zero's with the eights. This has happened to me! |
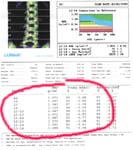
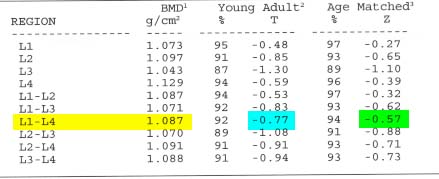 | Lunar Spine. The results often reported are from L2-4, but I don't agree with discarding 25% of the information, so I check the results for L1-4 which are buried in the table. |
On the Lunar machine is that the reported Z-score is adjusted for age AND WEIGHT. Usually this does not make much difference, but in obese or malnourished patients the results can be misleading. For example, someone with anorexia would appear be relatively better because she is compared to other thin persons rather than persons matched on age alone. This sometimes explains why the Z-score can be higher than the T-score.
After checking the images and the graphs, I report it this way in my dictations:
The bone mineral density was done using a _____ (Hologic/Lunar/Norland) machine.
The lumbar spine was .XXX g/cm2 which is XX standard deviations below (above) the mean for age-matched persons.
The total hip BMD was .XXX g/cm2 which is XX standard deviations below (above) expected for her age.
The T-score was XX at the spine and XX at the total hip . . .
(for females) . . . which places her in the WHO category of _______ (normal, osteopenia, osteoporosis, established osteoporosis). [Note that you need to know about fractures before you can tell the correct category.]
If the patient is male, I say "The World Health Organization has not specified cut-off ranges for males. "
In routine cases, it is possible to estimate the fracture risks and percentiles. The Fracture Risk Calculator provides an easy way to do this.
If there has been a previous DEXA, the images should be compared. The percent difference is reported; this must be done in the context of the reproducibility of the densitometer. Most careful studies show a mean error of 2%, so the difference is statistically significant if greater than 6%. If the bone density was previously done on a machine from a different manufacturer, then the values must be converted into standardized units.