


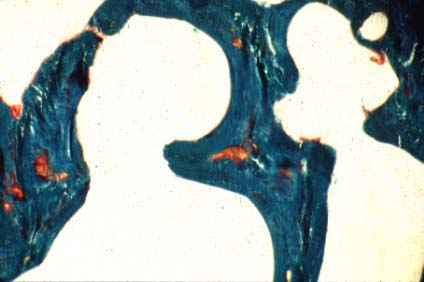


OSTEITIS FIBROSIS: A woman receiving hemodialysis with high PTH levels. The first photo is low power, showing areas of the higher power photos.

Also there are animations of bone metabolic units!
|
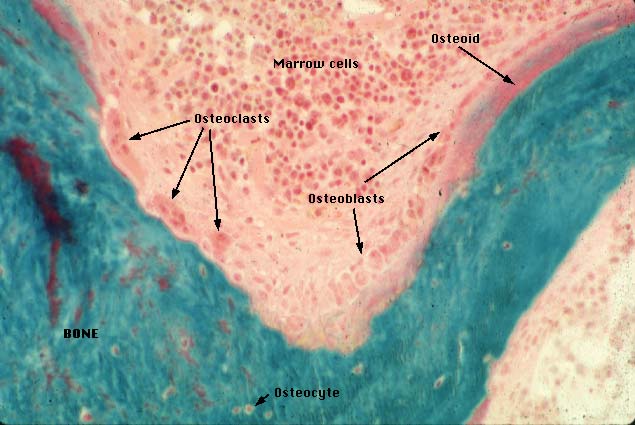
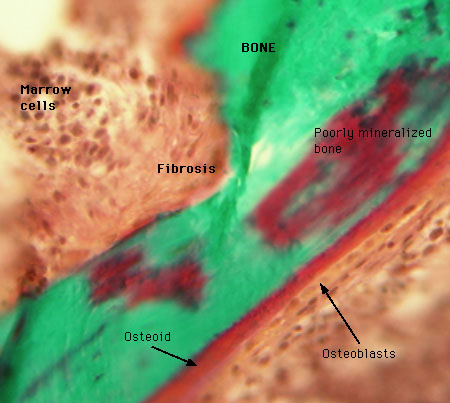
| BMU: A photomicrograph of bone showing osteoblasts and osteoclasts together in one Bone Metabolic Unit. The patient had hyperparathyroidism with high turnover so the osteoid is somewhat thicker than normal. | |
|
| WALL WIDTH: This polarized view shows wall width (the 2-dimensional measurement that can be converted to wall thickness). | |
|
|
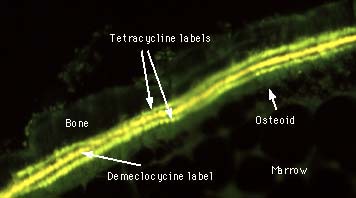
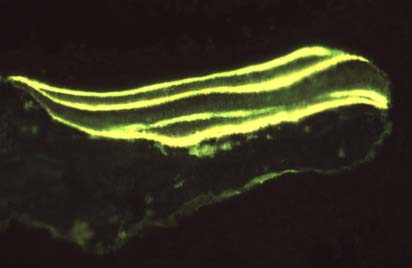
| TETRACYLINE: The first picture shows a triple label, each dose given 2 weeks apart. The second shows four labels. |
|
|
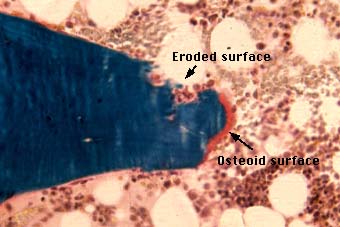
| ERODED SURFACES: The first shows a surface just beginning resorption. In the second the resorption has gone through the trabecula making a hole. |
|
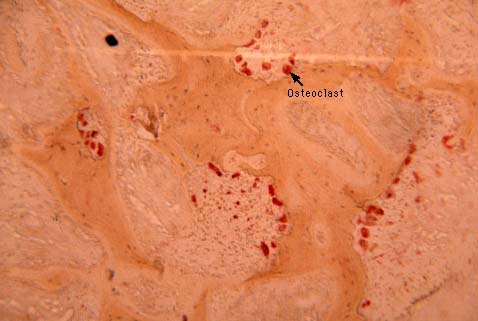
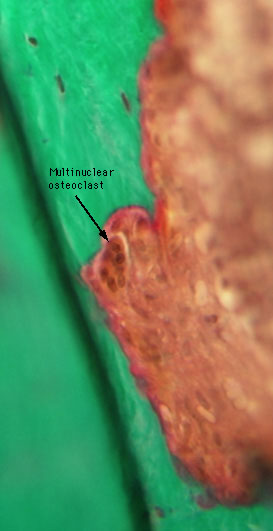
| BMU: OSTEOCLASTS: This stain turns acid phosphatase red. The patient had osteitis fibrosis and an unusually large number of osteoclasts. | |
|
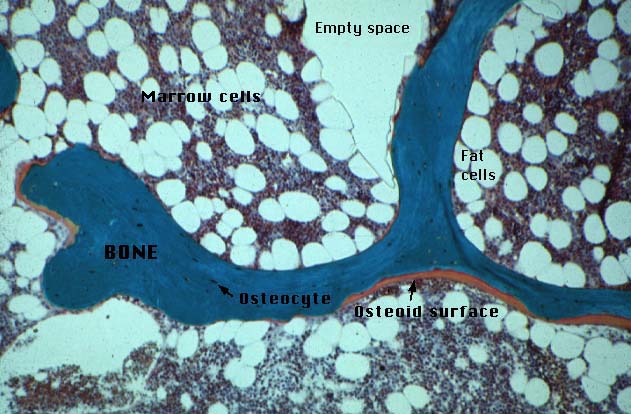
| NORMAL: A photomicrograph of a biopsy from my iliac crest when I was a fellow and we needed some normal controls. | |
|
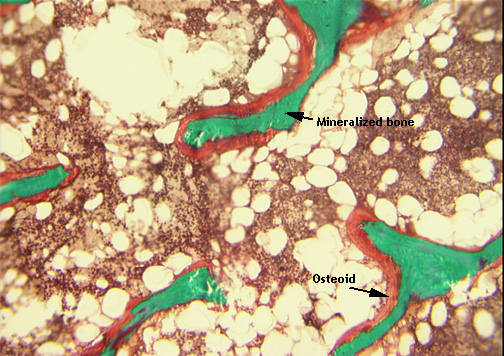
| NORMAL: A photomicrograph of a biopsy from a normal postmenopausal woman showing an osteoid seam of normal width. Mineralized bone is green and osteoid is orange. | |
|
|
| OSTEOMALACIA. The orange-staining osteoid covers many surfaces and is thicker than normal. The second photo is from part of the biopsy that was decalcified and thus it appears normal. The osteomalacia cannot be appreciated. |
|
| FOCAL OSTEOMALACIA: Both photos from the same section of a bone biopsy. Near the cortex is osteomalacia. This woman had been misdiagnosed as Paget's disease and had been treated with high doses of etidronate. | |
|
| ALUMINUM STAIN. This was from a dialysis patient with severe osteomalacia. Aluminum stains as a red line on the surface and in cement lines. | |
|
|
| OSTEOMALACIA. This patient had vitamin D deficiency. The second biopsy shows resolution of the osteomalacia after treatment. |
|
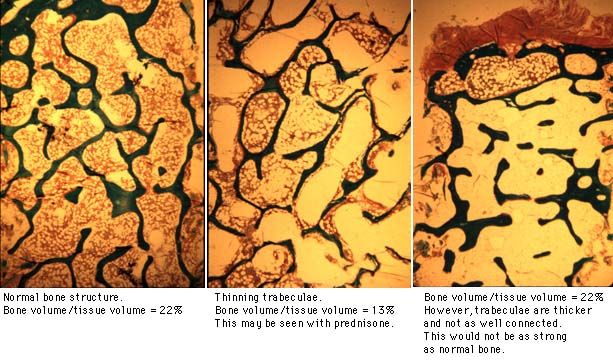
| TRABECULAR STRUCTURE. Three different biopsies showing normal structure, thin trabeculae, and poor connectivity. | |
|
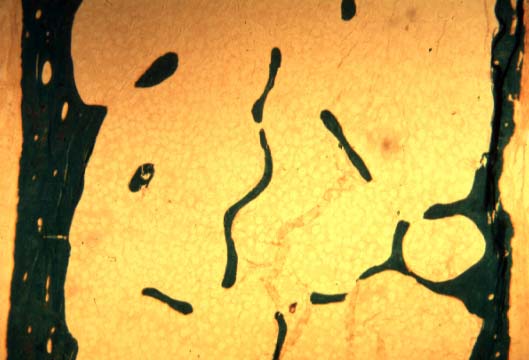
| OSTEOPOROSIS. This is a classic case of osteoporosis. It is a transiliac biopsy. | |
|
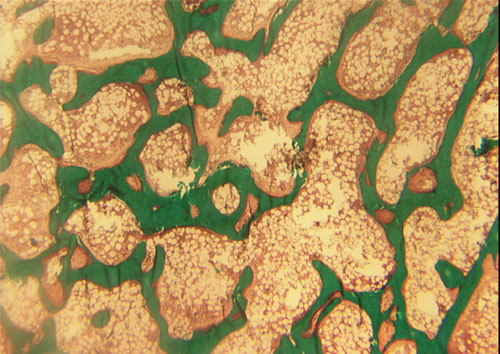
| SCLEROSIS. This is the opposite of osteoporosis. This case was due to secondary hyperparathyroidism. | |
|
OSTEITIS FIBROSIS: A woman receiving hemodialysis with high PTH levels. The first photo is low power, showing areas of the higher power photos. | ||
|
|
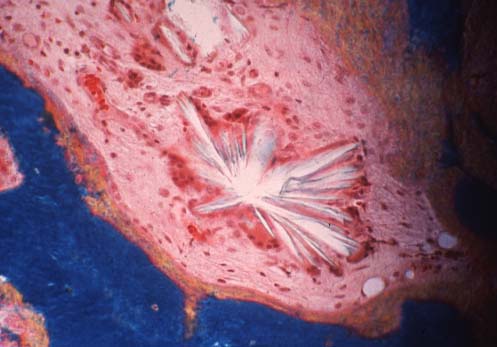
| OXALOSIS: The first view shows the giant cell reaction around the oxalate crystal. The second view is under polarized light. |
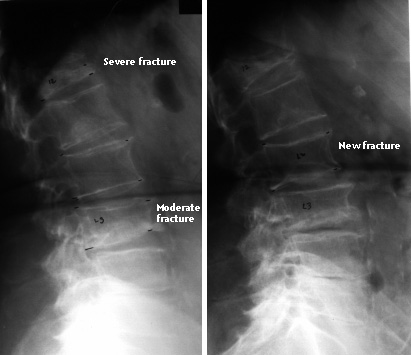
| Here is an xray from a patient who had a severe fracture at T12 and a moderate fracture at L3. Three years later a second xray revealed a new fracture at L2. |
| Home page |
|---|