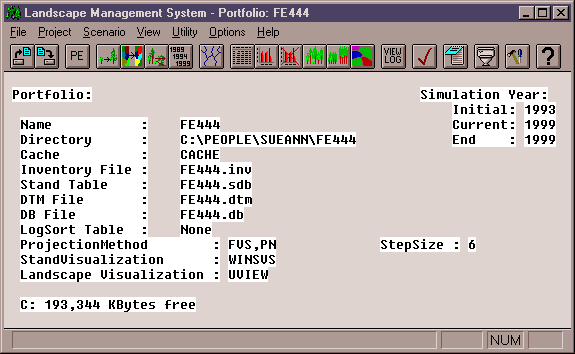
Prepared by Susan Seaberg The basis for any setting design is an analysis of the stand conditions within the sale boundaries. The analysis incorporates the trees' dimensions for calculating the largest economical payload or weight/turn. If a skyline logging system is to be utilized during the harvesting operation, this analysis will also aid in determining probabilities for locating tailhold trees with specific characteristics including tree diameters and heights. For our analysis we utilized the Landscape Management System or LMS (version 1.6). This program allows users to input data for a stand or stands and use a geographic growth model developed by the Forest Service to grow the trees and estimate size, volume, density for the stand. This program will also allow the user to treat the stand (thinning to a specific trees per acre or clearcutting) and predict the future stand condition. We were given the plot data for our stand from1993 in a lattice or ArcInfo.eoo file. These files need to be converted for use in LMS. Due to the immense size of our stand data we were not able to create these files on our own, however the creators of LMS were consulted and sent a copy of our database for conversion. The key files need in the program are stand database files or ".sdb" and stand inventory files, ".inv". The stand data file relates the tree data and spatial data; i.e. it combines the trees to a specific site. The inventory file contains all of the tree characteristics including species, dbh, height, and volume After creating these files you can begin making a portfolio. A portfolio in LMS contains all of the data created previously in addition to growth modeling variants (Projection Method: FVS, PN), the step size for simulation years and programs for stand visualization (SVS) and landscape visualization (UVIEW). An image of the portfolio used in our setting design can be seen in Figure 1.
Figure 1. Portfolio Window in LMS. This window shows location of portfolio, including inventory and stand data files, and growth variants applied to stand.
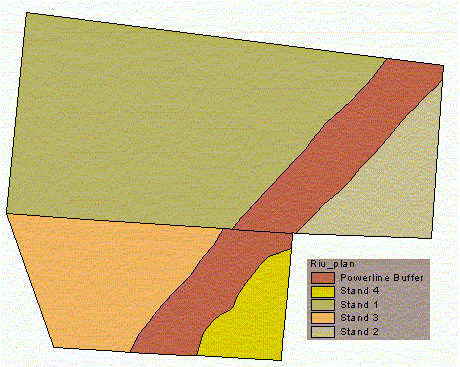
Now that the portfolio is setup, LMS will grow the trees (according to chosen step size and growth model variant), project the way the stand looks and compute many tables for any given set of stand characteristics. Within the setting design we were interested in the tree dimensions, including dbh and height for volume and weight calculations and the distribution of the trees according to size. Each stand was projected to 1999 using the Project menu. LMS uses the growth model chosen in the portfolio to grow the trees between each projection. At each projection the stands can be displayed using the buttons towards the middle of the toolbar with the trees growing tall and green. And the tables and charts can be displayed according to a wide range of choices (diameter distribution, height distribution, volume per stand, quadratic mean diameter, basal area, etc.) by using the buttons next to the display stands with tables and charts on them. Other buttons on the toolbar will allow the user to treat each stand or show the landscape with or without the trees on it. The sale area was composed of six polygons (stands) including two stands that did not contain any tree data. These two stands were underneath a powerline corridor where tree growth is not a desired attribute. Of the four remaining stands, two were beyond the powerline from the proposed road (See Figure 2 for a map of the different stands) and harvesting would have to be conducted from an additional road leading to these areas. This left us with two stands to conduct the analysis on. Picture of these two stands projected to 1999 can be seen below. Figure 3a is the stand in Township 25, Stand 23145 (stand 1 in Figure 2)and Figure 3b is the stand in Township 24, Stand 5036 (Stand 3 in Figure 2).
Figure 2. The spatial relationship between the four
major stands in the North Beacon Timber Sale. Stands 1 (stand 23145) and 3
(stand 5036) will be harvested.
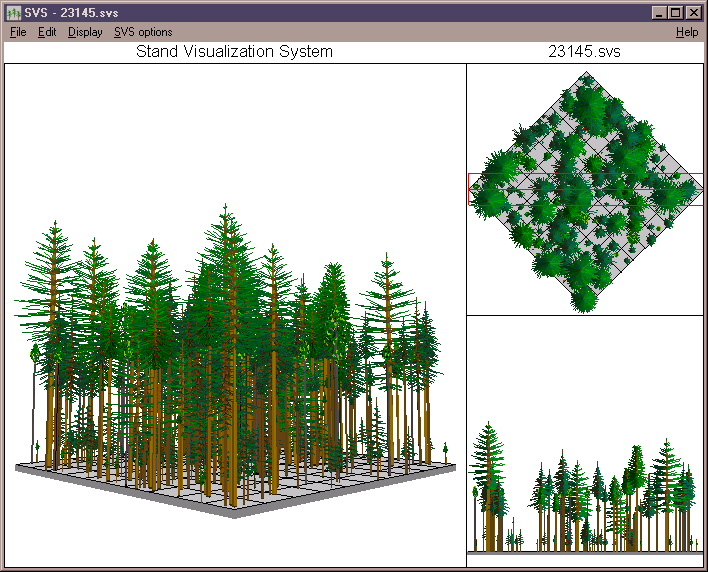
Figure 3a. Stand Visualization. Stand 23145 projected to 1999 shown in realistic (left), overhead (above right) and profile (lower right) views.
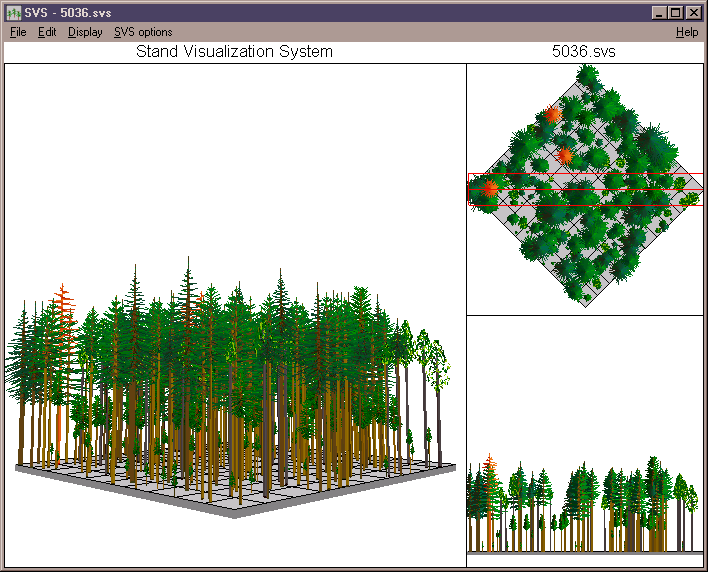
Figure 3b. Stand Visualization. Stand 5036 projected to 1999 shown in realistic (left), overhead (above right) and profile (lower right) views.
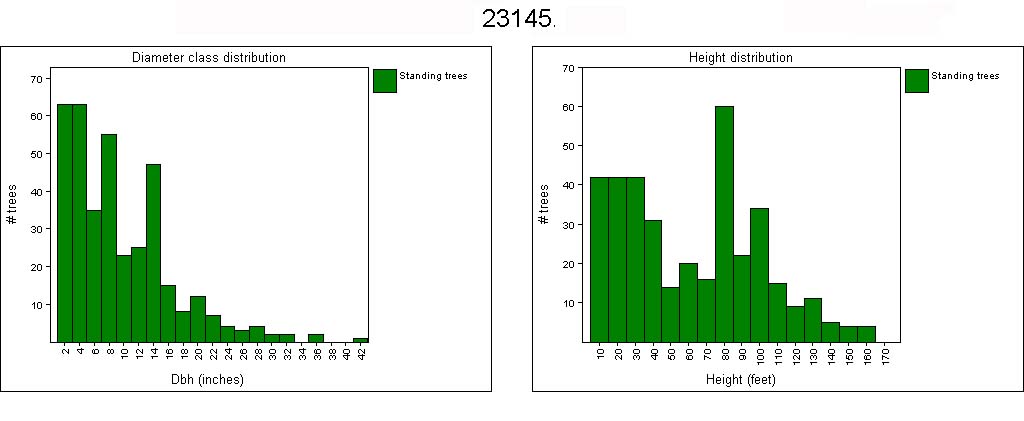
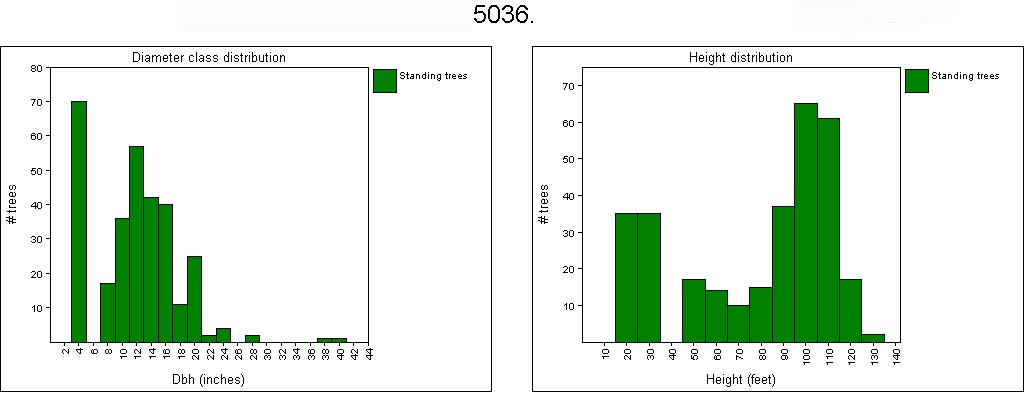
Analysis of these stands generated a series of tables and graphs that we could use for determining average payloads and distribution of potential tailhold trees. Figures 4 and 5 show the diameter and height distribution for each of these stands.
Figure 4. Stand distribution. Distribution of diameters and heights in 1999 for Stand 23145.
Figure 5. Stand distribution. Distribution of diameters and heights in 1999 for Stand 5036.
The information from figures 4 and 5 and a stand inventory table were used in determining the average payloads within each stand. Each stand contained 4 species that LMS identified, Douglas fir, Western hemlock, Red Alder and Other. Since Douglas fir, in all stands, were the largest trees and contained more occurrences than the other species, we used it as the design tree for our analysis. Table 1 is the results of the analysis for the design tree based upon the stand table generated in LMS. Table 1. Results of Stand Table for Design Payload. Tree species, Douglas fir was found to be the largest and most numerous species within the two stands. Average dbh and ht. were calculated including the standard deviation for the design payload.
The design tree was determined by the average dbh and height plus one standard deviation. Based on the dimensions of the design tree, the volume was calculated which determined the weight. The number of 32' logs that were within our design tree was calculated for reference when estimating the weight for 3.5 logs. These weights were then given to the LoggerPC experts for use in payload analysis based on topography and harvesting system. Lastly, LMS calculated total stand volume which was used in the production estimates. Back to outline
| |||||||||||||||||||||||||||||||||||||||||||||||||