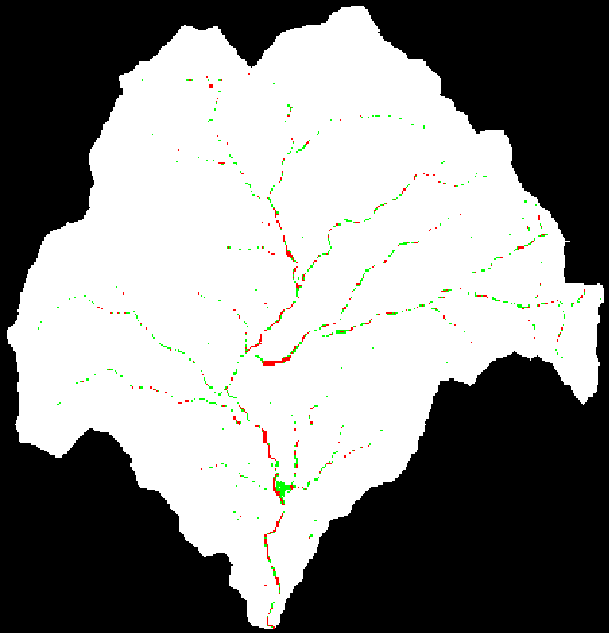
Fine Sediment Deposition in fish bearing streams
/*Channel Response AML
/*There are three groups in this
histogram:1 between -2 and -1.1, -1.1 and -0.2, and 0.69./*Therefore, use -0.1 for Unconfined, and -1.1 for Confined.
/*Fine Sediment and Fish
/*Using Channel Response Matrix Table E-2 pg. E-16
/*Assume streams with gradient < 4% are fish bearing /*Set variables /*NO Event = white (1) /*Fine Sediment (FS) = /*Streams with Fish (F) = /*Fine Sediment and Fish (FSF) = &sv UC = -.1 &sv C = -1.1 /*flow_dir = flowdirection (dem_filled, gradient) /*curvature = curvature(float(dem_filled)) SED = con(gradient < 1, con(curvature > %C% ,2,3),~ con(gradient < 2, con(curvature > %UC% ,2,3),~ con(gradient < 4,3,1))) mape dem_filled gridpaint SED &return This map relates fine sediment deposition with fish bearing streams. The Fish bearing streams fine sediment deposition occurs, the streams where course sediment occurs, the
then 4%, funny there do not seem to be any!
Deposition of fine sediment affects spawning fish, the green areas with course sediment deposition
are much better spawning environments.

1
. This map was produces using ArcInfo GRID tools. The AML was developed with assistancefrom Hakjun Rhee, Paul Reed, and Rachel Tyndall. Thanks