Washougal Watershed - Soils Data
Contributors
Paul Reed
Jen Shiu


Introduction
Soil information plays a very important role in conducting a proper watershed analysis. It provides unique information that distinguishes one watershed from another. The following report will explain the process by which the appropriate information was found and manipulated, so that it could be used in the Washougal Watershed Analysis.
In 1980, the Private Forest Land Grading System (PFLG) completed a five-year mapping program, which included the analysis of the Washougal Watershed. Originally, the information found was to be used for state taxation purposes of forestland. In 1995, the Department of Natural Resources (DNR) compiled a detailed description of soil information for the Washougal Watershed using the results from the PFLG mapping program and subsequent soil surveys. This information provided by the DNR served as a basis to our soil analysis.
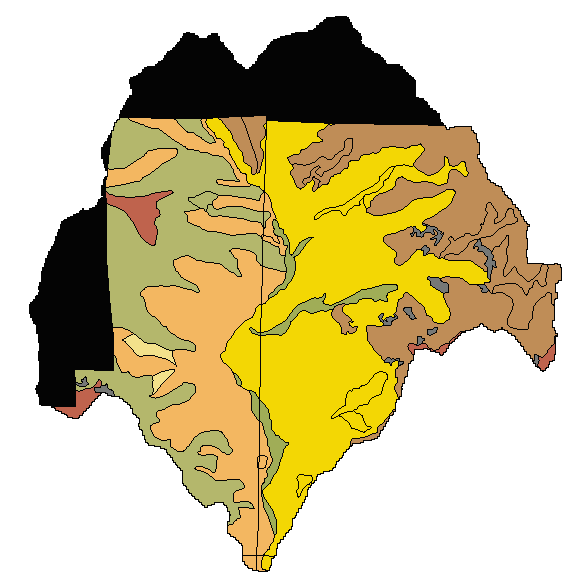
Although the soil information provided was extensive, it did not contain information for our entire watershed boundary. As you can see in Figure 1, there are areas were soil information is not available. These areas are part of the Gifford Pinchot National Forest and were not included in the PFLG soil survey.
Figure 1. This is a map of the Washougal Watershed Boundary overlayed on the soil coverage map provided by the DNR. Black spaces represent areas that do not contain soil information in our coverage.
Methods
The information provided by the DNR was in the form of a spatial polygon coverage and multiple data tables describing the soil in the watershed. The following data files and file descriptions were included with the coverage:
|
SOILS-CLASS |
Full soil classification name |
|
SOILS-CMPLX |
Soil complex names and slope characteristics |
|
SOILS-COMP |
Holds all combinations of unique soil IDs |
|
SOILS-MAIN |
Attributes from State Soil Survey publications |
|
SOILS-PFLG |
Soil Attributes originally recorded for PFLG maps |
|
SOILS.CROSS |
SOILS-POCA cross reference file |
|
SOILS.PAT |
Geographically specific soil data |
Other pertinent data about the soil layer and attribute tables can be found in the Data Dictionary, which was also supplied by the DNR. The polygon coverage was provided by township, so we map-joined five townships to produce the working soils coverage used in our analysis. We then permanently joined two attribute tables, soils-MAIN and soils-PFLG, to our polygon attribute table (PAT) using the joinitem command available at the ARC prompt. In the end, the soil PAT included over 70 attribute categories.
|
|
|
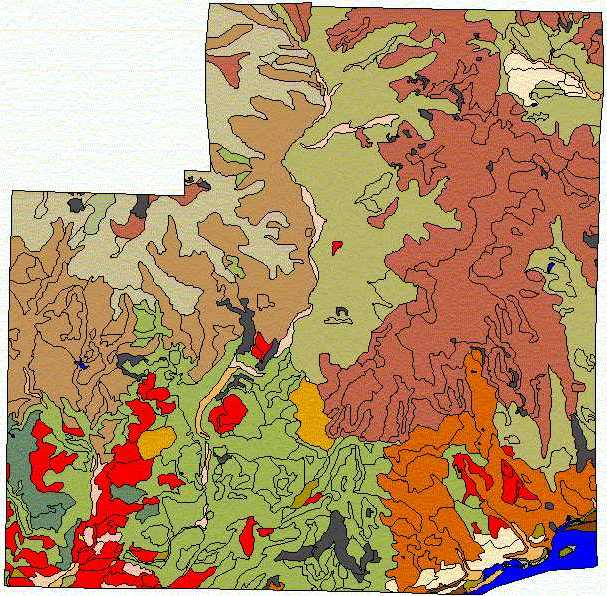
Figure 2. This is a map of soil type and location.
In addition to creating grids of soil cohesion, soil roughness, saturated soil conductivity and friction angle, two more grids were created, site index and parent material. The site index attribute was found in the PFLG table, the site index was then converted into a grid. The LULC module was able to utilize this grid. The parent material grid was created by taking attributes from the SOILS-MAIN table. The Surface Erosion module was able to utilize this grid.
The original data layers were projected into Stateplane HPGN from Stateplane NAD27. The reason for the change beyond the fact that the orthophotos were already projected to the NAD83 datum when attained, was that a much more recent, accurate survey with the latest GPS and surveying technology had been conducted to create the HPGN coordinate system from the NAD83 Datum (1983). The original Stateplane NAD27 was using a datum originally surveyed in 1927. A few more surveys have been conducted since then, so we reprojected our data to reflect the most recent update (HPGN).
Results
Once attributes were added, we created grids of some of the attributes possibly needed in our watershed analysis. The following figures are maps of those output grids. Since setting up the data coverages, was the objective, and not analysis, our results to this module are the output coverages themselves. Using the polygrid command, any of the 70 numerical attributes in the soil coverage could have been made into a separate grid.
![]()
Figure 3 - Soil cohesion (psf) is a characteristic of soil that defines a soil's ability to stick together. It is a convenient and important way to classify soils. This characteristic is vital in determining the probability of land failure, surface erosion and vegetative growth. The image above is a map of the different soil cohesion for the Washougal Watershed.
![]()
Figure 4 - Dry unit weight, g (pcf), is the weight of the soil with respect to volume. This characteristic can be helpful in classifying soils. The image above is a map of the corresponding dry unit weights for each soil in the Washougal Watershed.
![]()
Figure 5 - The saturated soil conductivity, represented by the Darcy coefficient of permeability, is a unitless soil property that describes how water flows through soils. This is an important characteristic in determining seepage and surface flow. The image above is a map of the varying saturated soil conductivity (k-value) for the Washougal Watershed.
![]()
Figure 6 - The friction angle (deg) is the critical angle where sliding occurs in a soil. It is important in analyzing possible failures. The image above is a map of the different friction angles (f ) for the Washougal Watershed.
![]()
Figure 7 - Site index is a "designation of the quality of a forest site based on the height of the tallest trees in a stand at an arbitrarily chosen age", 50 years for this analysis. This is an important grid that describes stand information, which is highly useful in the LULC module. The image above is a map that displays the site index for the Washougal Watershed.
![]()
Figure 8 - Parent material is the original foundation in which soil evolves from. It is important in determining erosion rates and soil stability. The image above is a map of the parent material type and location in the Washougal Watershed. The numerical codes must be looked up in the DNR Data Dictionary to interpret.
Discussion
As previously stated, soil information plays a critical role in a watershed analysis. It provides a basis to many of the modules analyzed. Once the attributes are added to the polygon coverage, it is simple to manipulate the data to perform different tasks. As you can see, the information generated from these layers are vital to many watershed modules, such as Surface Erosion, Mass Wasting and LULC.
The reliability of the soil data layers can be questionable due to the nature of the data collection. Often soil data is attained from sources whose main objective is a purpose other than a watershed analysis. For this analysis, the data was originally intended for state taxation purposes. A soil survey done for taxation purposes may not be as scientific and biologically minded as one performed for watershed analysis.
As stated earlier, the soil coverage does not extend to the edge of our watershed boundary. This will introduce error in conducting a full watershed analysis. The separate modules will have to be fully aware of the soil boundary and make adjustments accordingly if their calculations are affected too much. Errors will occur with flow calculations because the nodata areas will not contribute flow downstream. Different adjustments may be needed for each module, so I left it up to them to compensate. If this boundary issue causes problems, I would recommend either setting the values outside to zero (not eliminating error, but perhaps stopping the AML from crashing), or adding values of the major dominant soil type. This poses a question as to the degree of accuracy of the data being used and generated. Outside this course, the best way to avoid this problem, would be to search for more extensive soil data, which may, or may not be available.
In the end, I believe that the soils data is extensive enough, and contains enough information, to come up with good values in conducting a watershed analysis. The modules should not have too much trouble estimating around the boundaries. I do not believe that adding extra information outside of the boundary will change the critical areas much. It is now time to hand over the baton to the separate modules who utilized this data to acquire useful information about slope stability, erosion, and projected stand information.
References
Hammond, C., Hall, D., Miller, S., and Sweetik, P. Level I Stability Analysis (LISA) Documentation for Version 2.0. United States Department of Agriculture, April 1992.
Hurvitz, Philip. Personal Interview. 18 January to 11 March 1998.
Krogstad, Finn. Personal Interview. 13 January to 11 March 1998.
Schiess, Peter. Personal Interview. 18 January to 11 March 1998.
Washington State Department of Natural Resources. Data Dictionary, Washington, April 1997.
United States Department of Agriculture and Soil Conservation Service. Soil Survey of Skamania County Area: Washington, Washington:GPO, October 1990.