Assignment 1 Section B (15 points) updated 4 PM 10/2/06
Instructions: Study this page before logging into WebQ to submit your assignment. You will need to log in with your UW NetID. Please also be ready to enter your last name and the section in which you are registered (BB, BC, BD) to help the TA's sort the results.
If necessary, you will need to keep this page open in your browser as you work on WebQ in order to refer to the graphics in certain questions. There is no time limit on working online for this assignment, other than the deadline for submitting your finished work. You will be able to save draft work and return to it later, or return to a submitted assignment and revise it, as long as you do so by the deadline.
We strongly recommend that you compose your answers to this assignment on a word processor and save your document, then copy & paste the answers into the online WebQ page. That way you will have more time to consider your answers, you can compose mathmatical expressions more easily, and you will have a backup in case there are any problems with electronic submission.
Please save the confirmation code WebQ gives you when you submit your answers. This will help us to track your submission in case we have difficulty finding it.
We also urge to to start working well before the deadline so that you have time to find solutions to any problems that may arise.
- If you have questions about the content of the questions, please use Epost or contact your Section B TA.
- If you have problems operating WebQ, please contact TA Deni Malouf at ocn101ay@u.washington.edu.
Deadline: Thursday, October 5, 2006, 11 PM
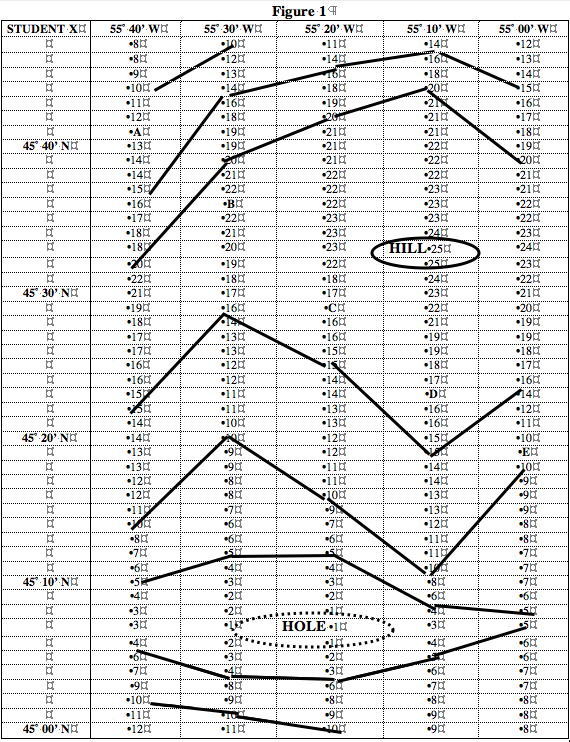
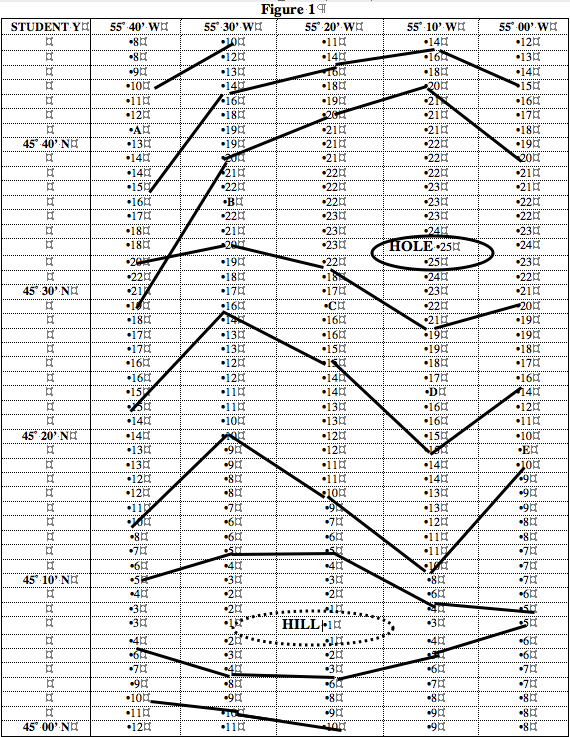
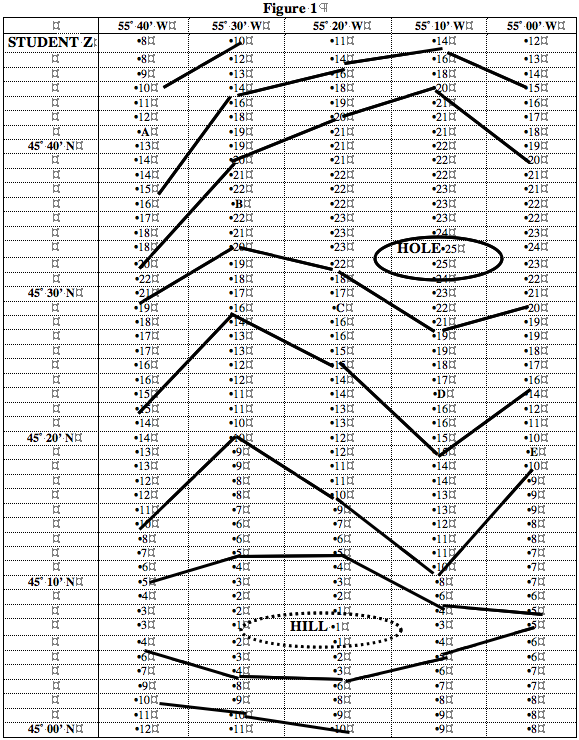
1) (1 pt.) Figure 1 shows three simplified versions of a map of depth soundings (arbitrary units) in a hypothetical sea floor area of the ocean. (To obtain these depth soundings, an imaginary ship steamed north along one line of longitude, then south along the next, measuring depth at each station.)
Three students have drawn bathymetric maps from these data by connecting dots representing the same depths to create isobaths (lines of constant depth). They used a contour interval of 5 units (i.e., drawing isobaths of 5, 10, 15 units, etc.), and labeled the shallowest ("hill") and deepest ("hole") spots.
In the space provided, identify which student (X, Y, or Z) drew the correct map, and explain what mistakes the other students made.
TIPS: • Isobaths should be drawn so as to separate areas of deeper and shallower sea floor.
• Isobaths may not cross nor branch, and may not be drawn outside the boundaries of the data.
• If the same depth appears repeatedly in a block, you can draw the isobath to any point in the block (top, bottom, center) as long as you are consistent and draw the same way each time the situation arises.
• If a depth is missing between a shallower and deeper depth, infer that the depth is present but was not measured and draw the isobath between the two adjacent depths. (This is called interpolating).
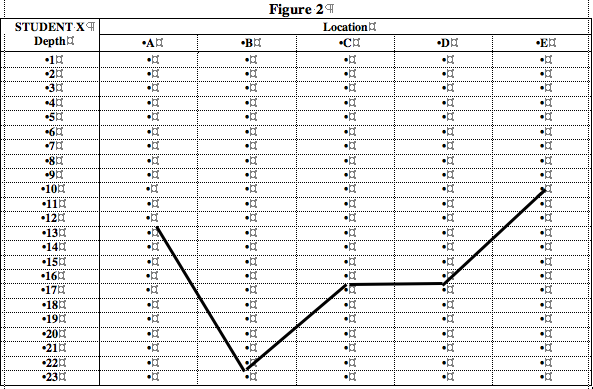
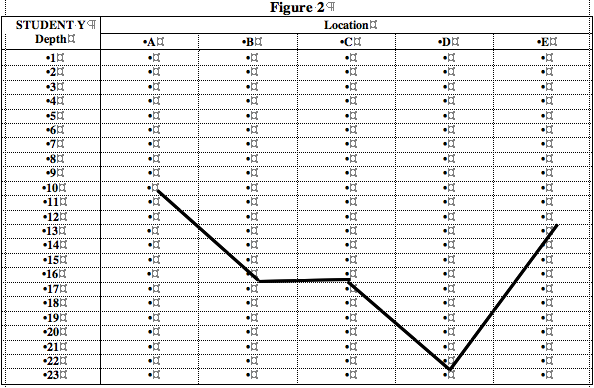
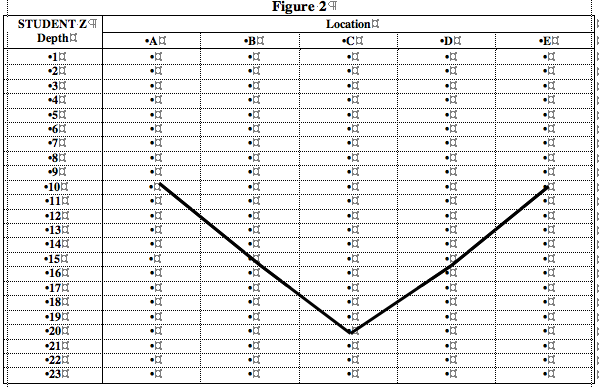
2) (0.5 pts.) The same three students drew “depth profiles” (Figure 2) that depict how the bottom would appear to a ship steaming along the track A-E in Question 1. To do this, they referred to the depths at points A–E in #1, which correspond to columns A–E below. Then they put an X by the depth in the appropriate column and connected the X's.
In the space provided, identify which student (X, Y, or Z) drew the correct profile, and explain what mistakes the other students made.
3) (2 pts.) Fig. 4, App. 4 [pp. 472-473] in Garrison, or another convenient world atlas, to find the latitudes and longitudes of the following islands.
a/ Azores (N. Atlantic) b/ Vancouver (N. Pacific) c/ Hawaii (N. Pacific) d/ Sri Lanka (Ceylon) (Indian)
4) (2 pts.) Again use Garrison or an atlas. If you found yourself at the following locations, on what islands would you be?
a/ 2˚S, 115˚E b/ 45˚S, 170˚E c/ 65˚N, 18˚W d/ 20˚S, 45˚E
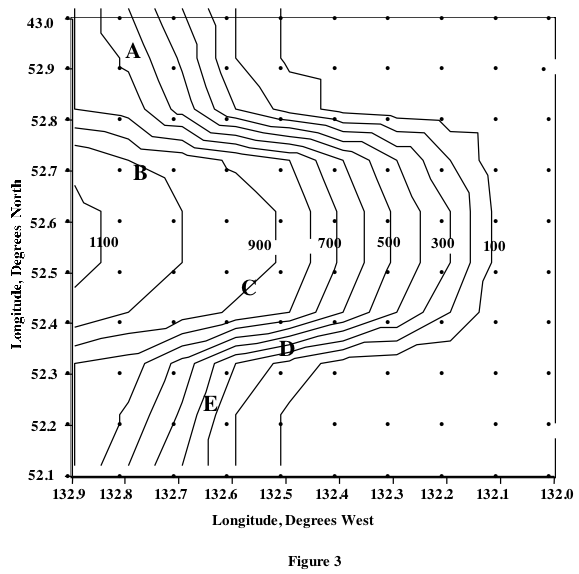
5) (1.5 pts.) Refer to Figure 3, a bathymetric chart showing isobaths (in fathoms) in an area near the coast. Using the latitude - longitude system on the grid (columns indicate longitude, rows latitude), answer the following questions.
a) What coast of what continent is portrayed in this chart?
b) What is the depth at 52.6˚N, 132.6˚W?
c) What is maximum depth of all points at and to the east of 132.1˚W?
6) (1.5 pts.) Suppose a ship steams over the area of sea floor depicted in Figure 3 and takes depth soundings along its route. It follows the transect marked by points A-B-C-D-E.
a) Between which two points would the ship see the depth as constant?
b) Between which two points would the ship see the depth increase?
c) Between which two points is the slope of the sea floor the steepest?
7) (1 pt.) Look at Figure 6.16 in Garrison (page 151), which is a world map depicting how the temperature of the sea surface changes at various latitudes and longitudes in the oceans. Each of the curved lines, called an isotherm, connects points having a particular temperature. The shading indicates areas of high and low temperature at the sea surface.
a) Over what approximate ranges of latitude and longitude do you find the highest temperatures in the Pacific Ocean and adjacent seas?
b) Over what approximate ranges of latitude and longitude do you find the highest temperatures in the Atlantic Ocean and adjacent seas?
8) (1 pt.) Look at Figure 6.17 in Garrison (page 151), which is a world map depicting how the salinity of the sea surface changes at various latitudes and longitudes in the oceans. Each of the curved lines, called an isohaline, connects points having a particular salinity value, such as 34, 35, or 36. The shading indicates areas of high and low salinity on the sea surface.
a) Over what approximate ranges of latitude and longitude do you find the highest salinity values in the South Pacific Ocean?
b) Over what approximate ranges of latitude and longitude do you find the lowest salinity values in the S. Atlantic Ocean?
9) (2 pts.) You are going to sea on the research vessel Guppy, which is 300 feet long, has a main deck area of 3000 square feet, and a hold volume of 30,000 cubic feet. Your European colleagues ask you to provide them these figures in metric units. Refer to Appendix I (pp. 464–465) in Garrison. Please show your calculations for full credit.
a) What is the length of the Guppy in meters?
b) What is the main deck area of the Guppy in square meters [m2]?
10) (1.5 pts.) The following questions require conversion between Fahrenheit & Celsius temperature scales. Refer to Appendix I (pp. 464–465) in Garrison. Please show your calculations for full credit.
a) What is human body temperature (98.6˚ Fahrenheit) in Celsius?
b) 10˚C =?? ˚F 20˚C = ?? ˚F 30˚C = ?? ˚F
c) At what temperature do Fahrenheit and Celsius thermometers read the same?