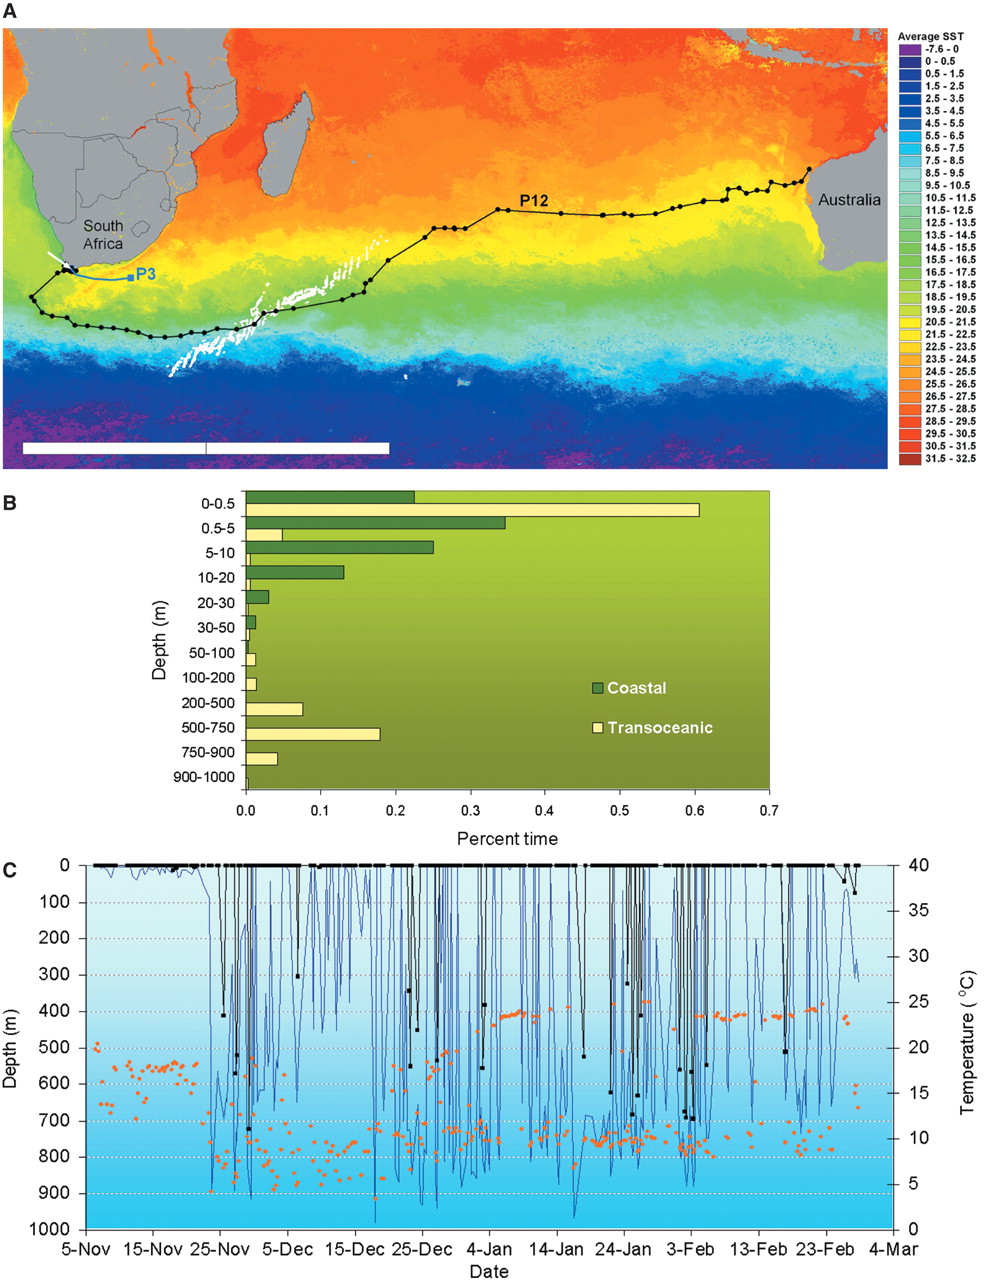
Fig. 1. Transoceanic migration of a white shark from South Africa to northwestern Australia and possible first leg of a second transoceanic-migrating shark. (A) Positions of (dots) and track followed by (black line) shark P12 during coastal and transoceanic movement; geolocation-estimated positions were corrected using SST data to derive positions shown (11). The first leg of another possible transoceanic migration to Australia (or an offshore movement toward the north-east coast of South Africa) is shown by the pop-up location of the PAT tag from shark P3 (blue line and square). Tagging and pop-up dates were as follows: for P12, 7 November 2003 and 28 February 2004; for P3, 14 April 2003 and 25 December 2003. SST is an average composite at 4 km resolution for daily Moderate Resolution Imaging Spectro-radiometer data from 23 November 2003 to 28 February 2004. Southwest Indian Ridge shown as white depth contours (100 to 2000 m). The scale bar represents 5000 km; the white arrow marks the tag deployment location. (B) Differential timeat-depth patterns during the coastal and oceanic legs of shark P12's trip, showing a bimodal pattern with a strong preference for the depths of 0.0 to 0.5 m and 500 to 750 m during transoceanic travel. (C) Minimum (black line and squares) and maximum (bright blue line) depths and minimum temperature (orange dots) visited during the coastal and oceanic phases of movement; all data are in 6-hour periods.
Ramón Bonfil, Michael Meÿer, Michael C. Scholl, Ryan Johnson, Shannon O'Brien, Herman Oosthuizen, Stephan Swanson, Deon Kotze, and Michael Paterson. Science 7 October 2005 310: 100-103 [DOI: 10.1126/science.1114898]Last modified: 5/05/2008 3:34 PM