Finding Interactions
The concept of an interaction can be a difficult one for students new to the field of psychology research, yet interactions are an often-occurring and important aspect of behavioral science. The following lesson will introduce the concept of a statistical interaction, provide examples of interactions, and show you how to detect an interaction.
What
is an interaction? 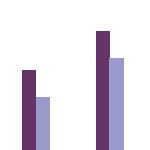
When two or more independent variables are involved in a research design, there is more to consider than simply the "main effect" of each of the independent variables (also termed "factors"). That is, the effect of one independent variable on the dependent variable of interest may not be the same at all levels of the other independent variable. Another way to put this is that the effect of one independent variable may depend on the level of the other independent variable.
In order to find an interaction, you must have a factorial design, in which the two (or more) independent variables are "crossed" with one another so that there are observations at every combination of levels of the two independent variables.
For example, if you were interested in the effects of practice and stress level on memory task performance, you might decide to employ a factorial design. You manipulate practice by having participants read a list of words either once or five times. You also manipulate stress level by having two conditions: in one (low stress), participants are told that the number of words that they recall is unimportant, and in the other (high stress), participants are told that most people can recall all words in the list, and that they are expected to be able to do so as well. Your dependent variable is the number of words recalled from the 30-word list.
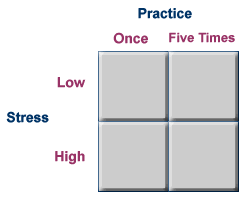
In this design, you would need to have participants in each of the four cells of the design: low stress and one practice, low stress and five practices, high stress and one practice, and high stress and five practices. Let's say here that you had 25 participants in each of these four cells.
Now, if the two factors in the study (practice and stress) interact, this means that the effect of one factor depends on the level of the other factor. Let's insert some data to see if there is an interaction in this study.
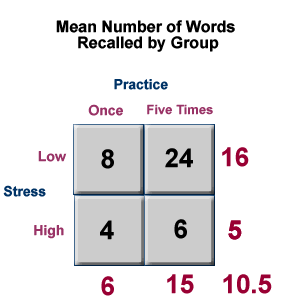
The table above indicates the cell means, as well as the marginal means and the grand mean, for the study. For example, the mean number of words recalled under the low stress, one practice condition is 8. This is a cell mean. However, the mean number of words recalled under all low stress conditions (regardless of practice) is 16. This is a marginal mean.
So, do we have evidence of an interaction in this study? One way to answer this question is to begin by describing the main effects: if we need to qualify our statements about the main effects by saying "it depends," then we have evidence that there may be an interaction. It appears that there may be a main effect of stress. High stress conditions result in recall of fewer words than low stress conditions. It also appears that there is a main effect of practice: five practices results in better recall of the words than just one practice. However, the effect of the practice variable depends on the level of stress (and vice versa): under low stress conditions, practice seems to have a substantial positive effect (an average of 8 words recalled with one practice and 24 words recalled with five practices), but under high stress conditions, practice has only a small effect (4 versus 6 words under the two practice conditions, respectively).
Therefore, we have evidence of an interaction in this study. Of course, you will need to carry out the appropriate statistical test before you can conclude that your evidence is strong enough to support the claim that there is an interaction in the population. You may want to know if there are other ways to detect this interaction besides examining the cell means.
Using graphs to detect possible interactions
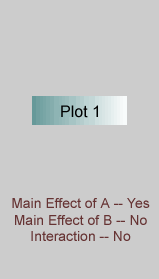
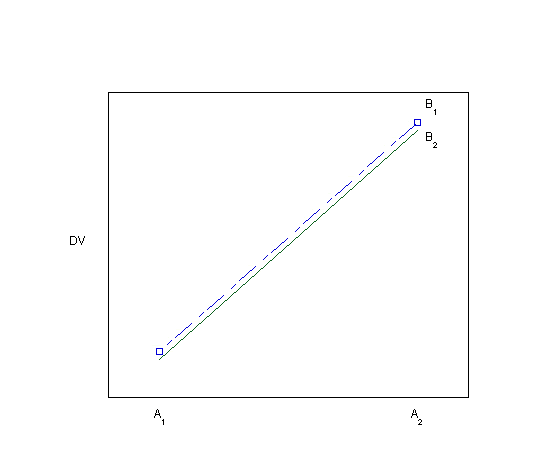
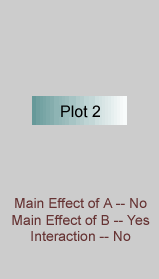
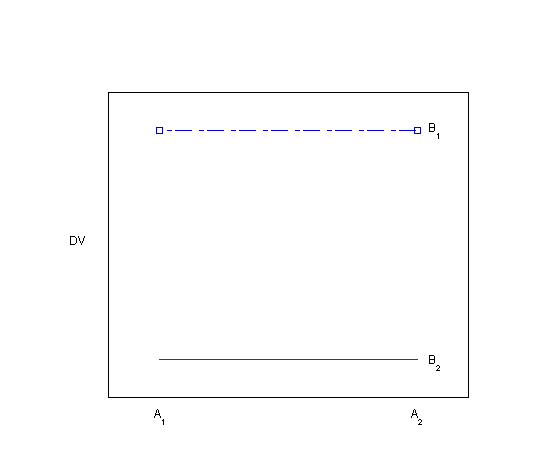
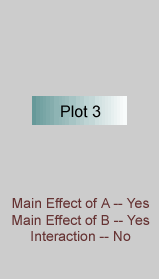
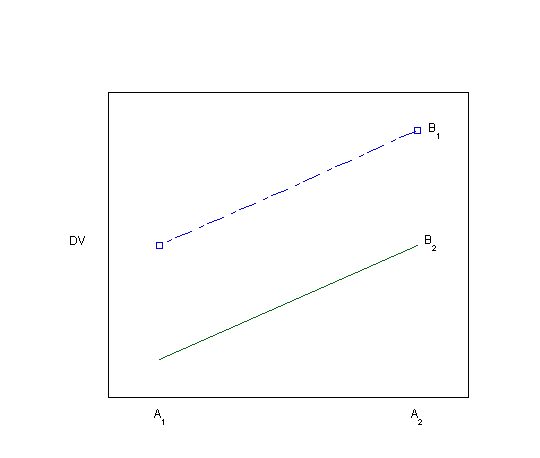
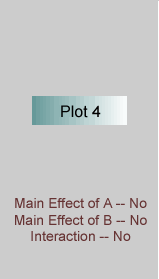
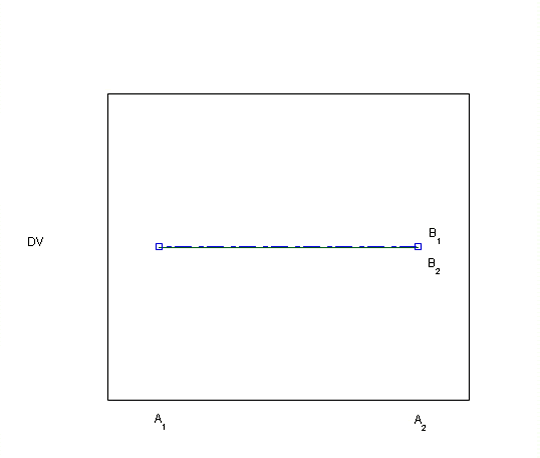
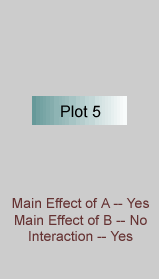
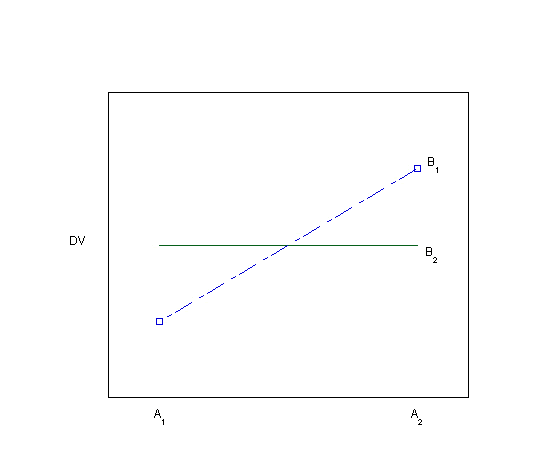
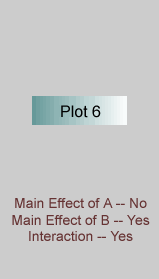
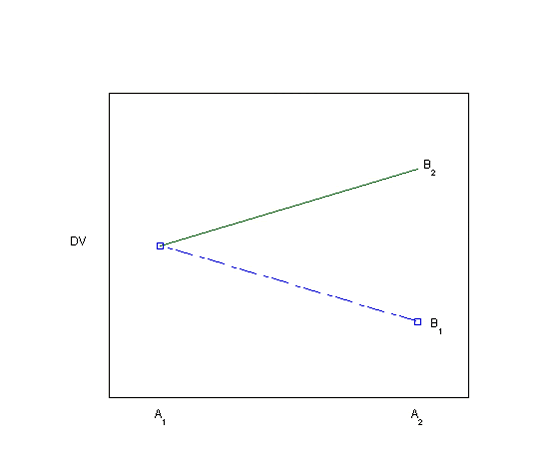
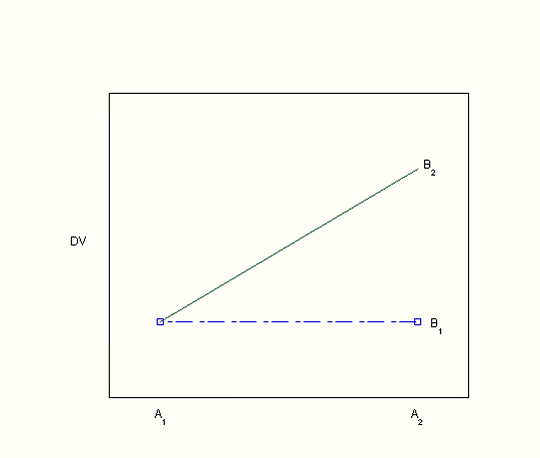
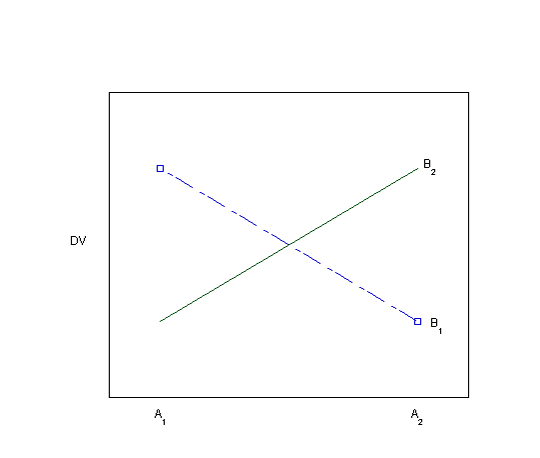
Visually inspecting the data using bar graphs or line graphs is another way of looking for evidence of an interaction. Each of the graphs below (Plots 1-8) depicts a different situation with regard to the main effects of the two independent variables and their interaction. You can visualize the main effects and interaction effects (if there are any) in both the line graphs as drawn and in the bar graphs, which are made visible by hovering over the "View as bar graph" button.
 |
 |
||||
 |
|||||
 |
 |
||||
 |
|||||
 |
 |
||||
 |
|||||
 |
 |
||||
 |
|||||
 |
 |
||||
 |
|||||
 |
 |
||||
 |
|||||
 |
 |
||||
 |
|||||
 |
 |
||||
 |
|||||
Exercise
Depict the data from the sample problem (the effects of practice and stress on word recall) as both a bar graph and a line graph. Is there evidence of a possible interaction? How do you know?