 |
|||
| |TESC 431 Home| |Intro| |Methods| |Results & Discussion| | |||
CTD ResultsTemperature, Salinity, Density Charts 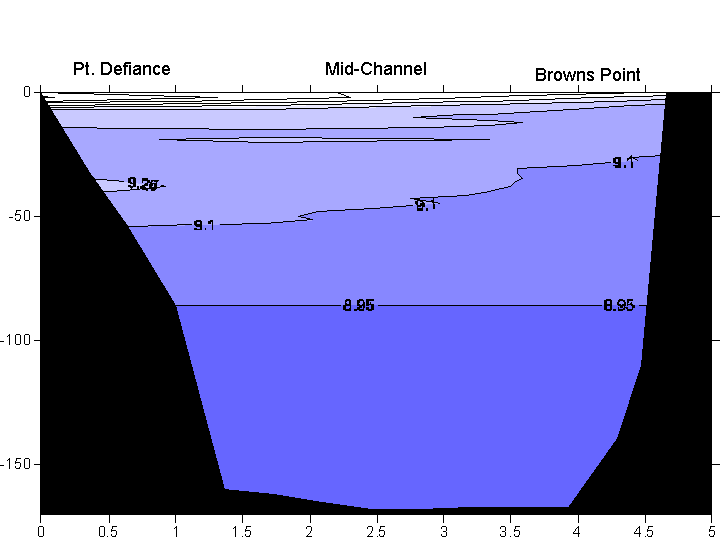 
Dissolved Oxygen Oxygen gets into water by diffusion from the surrounding air, by aeration (rapid movement) and as a waste product of photosynthesis. Adequate dissolved oxygen is necessary for good water quality. Oxygen is a necessary element to all forms of life. Natural stream purification processes require adequate oxygen levels in order to provide for aerobic life forms. As dissolved oxygen levels in water drop below 5.0 mg/l, aquatic life is put under stress. The lower the concentration, the greater the stress. Oxygen levels that remain below 1-2 mg/l for a few hours can result in large fish kills 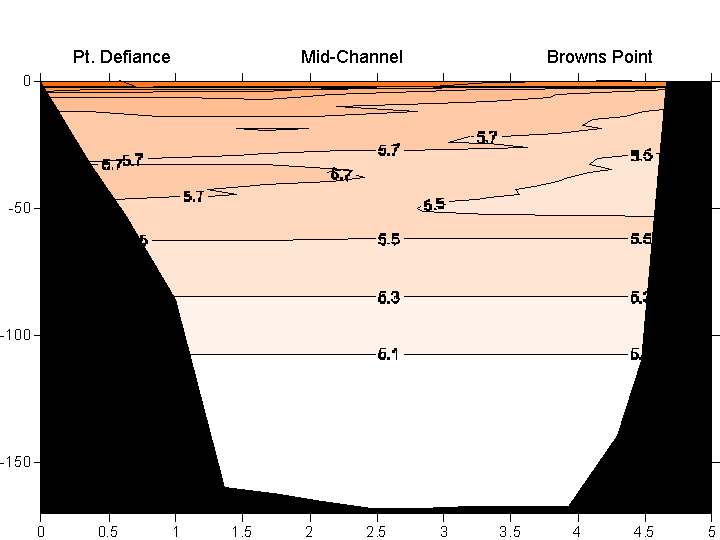 
Guideline for Interpretation of Dissolved Oxygen Readings: For mg/L: 0-2 mg/L: not enough oxygen to support life 2-4 mg/L: only a few kinds of fish and insects can survive 4-7 mg/L: acceptable for warm water fish 7-11 mg/L: very good for most stream fish including cold water fish For percent saturation: Below 60%: poor; water too warm or bacteria using up DO 60-79%: acceptable for most aquatic organisms 80-125%: excellent for most aquatic organisms (Annis Water Research Institute, 2005) Fluorometer:  
The fluorometer data shows that shallow water tends to hold more organisms that fluoresce. The stations that had the most oxygen seem to also have the highest rates of fluorescence at shallow depths and also have the greatest change in fluorescence from shallow to medium depths. This indicates that most organisms in the water that have the ability to fluoresce. Station #3, Browns Point, had a lower fluorometer reading than the other stations. This data from Commencement Bay is uniform throughout the depths, with some variance at shallow depths. Transmission & Secchi Disc Charts The transmission data indicates how much suspended material is in the water, whether those be organic or inorganic matter. The transmission data shows station #7, the Puyallup River delta to be the least clear, which could be caused by sediment and other particulates being stirred up by the river currents into the bay. Station #3, Brown Point, had the highest percentage of transmission at shallow levels than any of the other stations, possibly due to the influence of the colder, denser ocean water that was recorded at that site. Also at station #3, percentage transmission readings start at ~ 25% transmission and peaks at ~ 105% transmission, while the other stations percentage of transmission stays within 60% to 95%. This data correlates well with the Secchi disc data that shows station #3 to have the clearest water with station #1 coming in second. According to the Pierce County Public Works and Utilities website, the Browns Point area is a heavily urbanized area which has stormwater runoff, erosion and residential non-point sources of pollution. These are difficult sources of pollution to identify and regulate. This can have a huge impact on the water quality there and its ability to sustain life. When there are more organisms or other material in the water, this also makes the Secchi disk harder to see, which could be the case at station #5 and station #2, having the shallowest depths recorded for the Secchi disc during this research. Sediment SamplesPSAMechanical Sieve The sediment data shows the medium to small sediment particles were predominant at station #7and could indicate high turnover from currents. Station #7 sediment could be from the Puyallup River delta dropping its load.. The data obtained from the Particle Size Analyzer (PSA) method is more detailed yielding finer results than the relatively course data obtained from the mechanical sieves. Also, the PSA analyzed sediment that was measured in percent volume while the mechanical sieved measured in percent mass. Although both of these methods yield similar distributions, they cannot be compared directly (Greengrove, 2005). NutrientsIn colder months, the nutrient levels are higher at surface and at depth; whereas, in the warmer months nutrient levels are lowest. The reason for this trend is that biological activity is lower in the winter months in accord with higher overall nutrient levels, as nutrients are not being used for biological processes; whereas, biological activity is higher in the warmer months and overall nutrient levels are at their lowest because nutrients are being used for biological activities. In the year 2000, the Department of Ecology sampled nutrient levels at the location CMB003 and is located off of Browns Point. This graph measures nitrate (umol) levels vs depth (m) beginning with the month of January and ending in the month of November. Nutrient measurements were taken at depths of 0.5 meters, 10 meters, and 30 meters.ChlorophyllChlorophyll is the pigment that allows plants, including algae, to convert sunlight into organic compounds in the process of photosynthesis. Chlorophyll-a is the predominant form of chlorophyll in algae but excessive quantities of chlorophyll-a can indicate the presence of algae blooms. Algae blooms usually consist of a single species of algae, typically a species undesirable for fish and other predators to consume. Unconsumed algae sink to the bottom and decay, using up the oxygen required by other plants and organisms to survive. The presence of too many nutrients, such as nitrogen and phosphorus, can stimulate algal blooms and result in reduced water clarity. (Chesapeake Bay Program) .PlanktonPhytoplanktonZooplankton Chain Diatoms and Centric Diatoms were the predominant plankton in our sample. All diatoms are found in nutrient-rich, cold water. This large number of diatoms and the CTD data indicate well-mixed waters. Good mixing, the nutrients in the land runoff, and a water column made stable by the addition of fresh water combine to make shallow coastal regions very productive. Where more light and oxygen would be available, and possibly more nutrients, it would be reasonable to find more plankton. The deep tow zooplankton data showed more organisms than the surface night sample especially of the copepods and Nauplii which had a thirty fold increase. Zooplankton come up and eat at night and so are found in lower depths during the day. There are more copepods than any other kind of zooplankton in the oceans and marginal seas. Copepods are a link between the phytoplankton, or producers, and first-level carnivorous consumers. With the high amount of phytoplankton in the area, this is reasonable to deduct that this ecosystem can support a large amount of consumers of the phytoplankton. Data Repository |
|||