What is an osteoporotic fracture?
When and how did the fracture happen?
What is a unit of alcohol?
What if spine is different from hip?
Other diseases
Limitations of FRAX
Making treatment decisions

The T-score compares a person's bone density to a reference density. For FRAX, the reference is a young white woman. However, for men and non-white women, the companies report T-scores differently. For FRAX in white women, use the either T-score or BMD. Otherwise, note the kind of machine (Hologic, Lunar, or Norland) and enter the actual BMD (g/cm-squared) for the femoral neck.
The FRAX databases used femoral neck because there was longer term data with that value, despite the fact that a large study by Leslie reported that the total hip was the best predictor of future fractures
A new version of FRAX released May 2013 also includes QCT and ultrasound measurements. The references do not give details about how fracture prediction using these techniques compares with predictions using DXA.
The World Health Organization has done a huge meta-analysis of fracture prediction from cohorts around the world. There were 9 prospective cohort studies with 46,340 persons, and validation was done in another 11 cohorts with 230,486 persons, and altogether there were 1.2 million person-years included in these observations (Kanis JA).
The risk factors were chosen because they:
Answer "yes" to the question about previous fracture if one of the bones in this figure was broken as an adult. Do not count fractures from automobile accidents or similar trauma.

This image shows the bones that fracture more often in people with osteoporosis; the ones colored green are the sites of "major osteoporotic fractures": hip, spine, shoulder and forearm.
Kanis described an osteoporotic fracture as one associated with low bone mineral density and had an increased incidence with adult age. These are: vertebral, rib, pelvis, humerus, forearm, hip, other femur, tibia, fibula, clavicle, scapula, and sternum. Ankle is not included, because these do not increase with age and are not related to BMD in older women, and have different risk factors. Ankle fractures are associated with heavier weight and are not associated with early menopause, whereas these are important risks for osteoporotic fractures.
Leslie, from Manitoba, has recently presented data from women who were followed several years after having BMD, to see which fractures were predicted by bone density. Those with significant odds ratio for having a T-score lower than -2.5 were: vertebra, rib, pelvic, humerus, forearm, and hip. Foot fractures were borderline. Again, ankle fractures were not related to bone density. The Study of Osteoporotic Fractures, in the USA, found generally similar results, with relative risks above 2 for the osteoporotic fractures, no increase in risk for ankle fractures. In the data-bases used to determine the FRAX risk, different studies used different types of fractures. 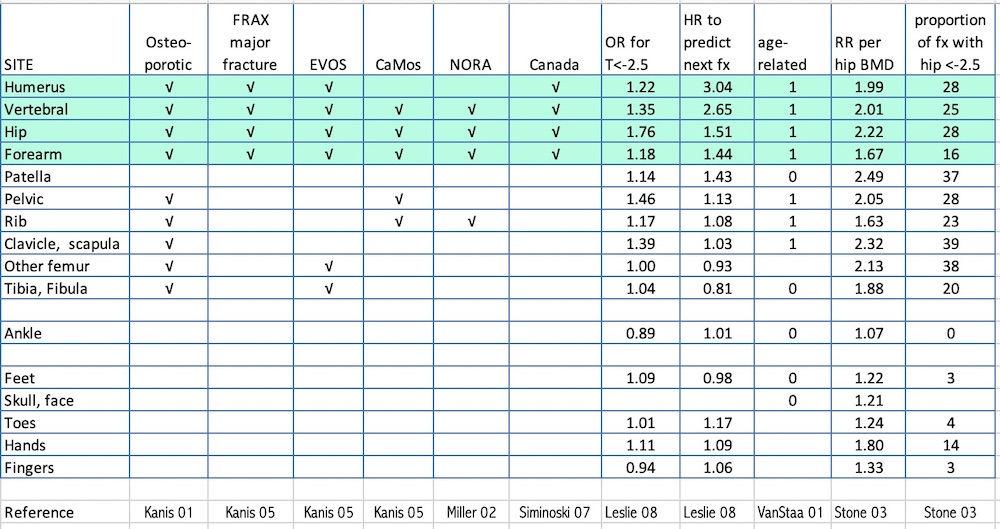
The cohorts that provided input to the FRAX calculations used various questions about the timing of the fracture (Kanis JA), including any adult fracture, fracture older than 15, 25, 30 or during the last 5 years. The results were not significantly different.
Most of the FRAX cohorts did not specify low trauma, but the FRAX web page suggests using low trauma. Recent papers, however, have shown that limiting the fractures to low-trauma ones does NOT improve fracture prediction (Mackey DC) and a study from Australia suggests that exclusion of high trauma fractures underestimates the true prevalence of osteoporotic fractures (Sanders KM). However, it is not clear if fractures from very high trauma actually predict future fractures, and it seems reasonable to exclude automobile accidents.
For the FRAX calculator, answer "yes" if you generally drink more than 2 drinks/day.
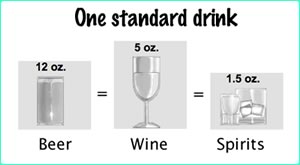 A "unit" in the UK is 8 g ethanol.
A "standard drink" in the USA is 14 g. (NIAAA)
The FRAX asks for 3 or more units = 24 g, which is slightly less than 2 US drinks/day (28g). The volumes in the UK units are smaller than the US volumes (for example, since one oz. = 30 ml, a standard glass of beer is 360 ml in the USA and only 285 ml in the UK.)
The alcohol data came from only 3 of the cohorts, including 4939 men and 11032 women. There was no risk with 2 units or less a day (16 oz, slightly more than one USA standard drink). Above that the risk increased. Alcohol tends to increase both the bone density and the risk of fractures, so that BMD is somewhat falsely reassuring in those who drink alcohol.
A method of using spine measurements has been proposed by Leslie, based on data from Manitoba, Canada. They suggest to increase/decrease FRAX estimate for a major fracture by one tenth for each rounded T-score difference between lumbar spine and femoral neck. "For example, consider an individual with a femoral neck T-score of −1.7 and a major osteoporotic FRAX probability of 18%. If the lumbar spine T-score is −3.5 then this indicates an offset of −1.8 (−3.5 minus −1.7). This is rounded to the nearest whole number (−2). One tenth of the FRAX estimate based upon the femoral neck is 1.8%, which is multiplied by the rounded offset value (giving 3.6%). This is then added (because lumbar spine T-score is worse than femoral neck T-score) to the original FRAX estimate (18%) giving a final (rounded) probability of 22% (18%+3.6%)."
Checking this box will increase the fracture risk if you do not use bone density, but if bone density is added, the secondary osteoporosis does not add to the risk. The instructions state: "Enter yes if the patient has a disorder strongly associated with osteoporosis. These include type I (insulin dependent) diabetes, osteogenesis imperfecta in adults, untreated long-standing hyperthyroidism, hypogonadism or premature menopause (<45 years), chronic malnutrition, or malabsorption and chronic liver disease . I agree with my nephrology colleagues that chronic kidney disease should also be on that list. Many diseases and medications can increase fracture risk, both because they decrease bone density and they increase risks above and beyond the effects on the bone density. This is too complex for an epidemiological survey, so clinical judgement must be used. For example, osteopetrosis results in high bone density but also increased fracture risks, and this would not be detected by the fracture risk calculator because it is such a rare disease.
Corticosteroid medicines, such as prednisone, have effects which are related to dose and duration, but that is also too complex for any general calculator. The instructions on the FRAX website now say to enter yes for exposure of at least 5mg/day for longer than 3 months. The risk of a fracture is greater with current use and higher dose.
If BMD is included, then changing weight does not alter the fracture risk. However, in a meta-analysis about weight that was used to predict fracture, it was shown that low body mass index increased the risk of fracture even after adjusting for the bone density (De Laet).
It is important to point out that these studies can never be repeated. Now that we know that low bone density and clinical risk factors can lead to fractures, and we have treatments that can help reduce these fracture risks, it would not be ethical to follow people with low bone density or multiple risk factors without treatment just to see what happens.
The International Osteoporosis Foundation, who have supported FRAX, list these limitations on their website
Many people confuse the results of FRAX with the recommendations for treatment based on the results. The FRAX does the best job available for predicting fractures, but it can't tell if a treatment will safely reduce the fracture rate or not. That will depend on other factors such as the underlying diseases, allergies, risks of medicines, interactions with other medicines, cost, and safety. There are still many unanswered questions.
If you have questions, please send me an email message.
Updated 2/25/16