 |
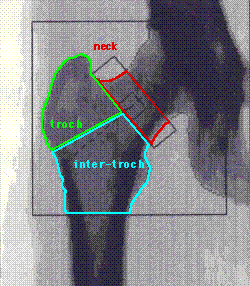
The image shows the regions usually measured on the proximal femur: Neck, Trochanteric, and Inter-trochanteric. All three together form the "total hip" - which is not actually the hip joint at all. Ignore "Ward's triangle" which is an unreliable square. Note that the trochanteric region is less dense because it has more trabecular bone. Also, it is critically important that the cutoff line at the bottom is in the standard place, because even one pixel will include more of the dense bone of the shaft and make the measurement inaccurate.
When a patient has a follow-up scan, it is crucial to check that the images look similar; hip rotation is responsible for most of the errors in reproducibility. Look for the lesser trochanter to see if it has the same shape on each view. Also check the neck region of interest to see how close it is to the greater trochanter. |
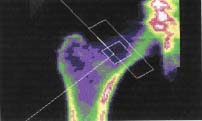 |
This is an image from Lunar. The newer densitometers include the total hip, the older ones only the neck and trochanter. |
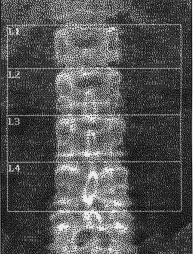 | 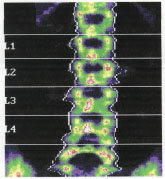 |
The first 4 lumbar vertebrae are measured. Many conditions or artifacts can make the spine data inaccurate, including: scoliosis degenerative arthritis compression fractures spondylitis aortic calcifications navel jewelry surgical changes Paget's disease |
Updated 10/5/02