|
The early bone density machines in the 1970's and early 1980's all used different kinds of units, so results were reported in Z-scores to allow comparisons to normal people. Later bone density was measured in large populations and the Z-scores were compared to the general population and not just to healthy people.
In the 1990's most people were using DEXA machines, which report units in g/cm2. But when the bone density machines became commercial, the different companies would not agree on a standard measurement. A person would be about 6% higher on a Lunar machine than on a Hologic machine, even though both said they were reporting g/cm2. If the companies would have used the same standards, then we could always just look at the plain bone density in g/cm2, just like we look at cholesterol in mg/dl or weight in kg. Unfortunately, that did not happen. Instead, the T-score was invented. T-scores are not used (to my knowledge) in any other aspect of clinical medicine, and for 20 years they have caused trouble and confusion.
Some investigators have tried, unsuccessfully, to establish a "standardized" unit of mg/cm2. Equations have been published to convert Hologic, Lunar, or Norland measurements to standardized units. The NHANES study also reported the standardized units. The equations and converters are on the page about standardization.
The reference ranges are also problematic. Currently the NHANES study (Looker) is used for the hip reference data by everybody. The different machines still use their own reference data sets for the spine because the spine was not included in the NHANES study.
Z-scores can be used to compare a measurement to a reference value. The z-score is the number of standard deviations away from the average value of the reference group. This reference group usually consists of people of the same age and gender; sometimes race and weight are also included.
This table shows how z-scores correspond to percentiles. The percentile is the percent of people in the population who have a lower bone density. A person who is average has a Z-score of zero and is at the 50th percentile. If the Z-score is -0.84 then 20% of people have a lower bone density.

Pediatricians use percentiles to interpret the height of a child. A child at the 5th percentile (same as Z-score of -1.65) is short for his or her age, and one at the 75th percentile is somewhat taller than average (Z-score of 0.68). The Z-score does not tell how tall a child is, because the average child gets taller as she gets older. On the other hand, if you know that a child is 40" tall, it does not mean anything unless you also know his age. You must know both the age and the percentile to know if this is a healthy height.
For bone density, the Z-score will tell you if the bone density is close to the average value for the person's characteristics such as age, race and gender, but that still does not tell you if the bone is strong. Elderly white women have weak bones even if the bone density is average.
You need to have a table of reference values showing the mean (average) and standard deviation (SD) for the age, gender, race, skeletal site, and densitometer measurement units. I call this the "expected BMD". The following table gives values from NHANES dataset. Then you use the formula:
Z-score = (Patient's BMD - expected BMD) / SD
To calculate BMD if you know the Z-score, use the same equation rearranged:BMD = expected BMD + ( Z-score x SD )
|
For example, a white woman aged 55 with BMD of 850 has a Z-score of (850-876)/139 = -0.18
A black man aged 55 with BMD of 850 has a Z-score of (850-1072)/185 = -1.20 A 65 year old white woman with a Z-score of -2 has a BMD of 809 + (-2 x 140) = 529 A 25 year old white woman with a Z-score of -2 has a BMD of 955 + (-2 x 123) = 832 | |||||||||||||||||||||||||||||||||||||||||||||||||||||||||||||||||||||||||||||||||||||||||||
Epidemiologists measure bone density in a large population, then wait to see who fractures their bone. Using statistical models, they calculate the risk of fracture for each standard deviation below the mean for the age, race and gender. This is the "relative risk". These risks depend on the population, skeletal site of measurement, technique of measurement, and type of fracture. For example, DEXA of the hip has a relative risk of about 2.5 for each standard deviation for predicting hip fracture; therefore, a person with a z-score of -1 has 2.5 times the chance of a hip fracture compared to a woman with Z-score of zero (average). You still don't actually know what the fracture risk is unless you also know the risk of an average person, which depends on age, race, gender and other factors not related to the bone density. This topic is discussed in greater detail in the section about BMD and fracture risk.
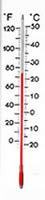
 Converting the BMD to the T-score is like converting the temperature from degrees Fahrenheit to degrees centigrade:
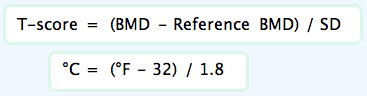
The reference BMD and standard deviation (SD) are to a young person instead of a person the same age as the patient. The reference BMD depends on:
For example, this "thermometer" shows the values measured by a Hologic densitometer at the total hip in a Caucasian woman from the NHANES study. The reference BMD is 0.942 and the reference standard deviation is 0.122. When the T-score is -1, the bone density is 0.820 no matter how old the person is. The white numbers are at the average values for that age.
The T-score does not necessarily have to compare people of the same race or gender. A black man can have a T-score compared to black men, white men, or white women, depending on which reference BMD is used. This gets confusing because the bone density machines in the USA report the T-score based on race and gender but the WHO calculator bases it on the values for white women.
Notice that when the T-score is zero (average peak bone mass) the bone density is highest in black men and lowest in white women. At very low T-scores, however, the bone density is the same. This is due to differences in the standard deviations of the young populations.
The newest WHO fracture risk calculator uses T-scores based on Caucasian women for all the risks. Here is a converter, based on the NHANES data-base at the femoral neck. It gives the white-female-referent-T-score when you enter another sex-and-race-referent-T-score:
This shows the derivation of the equations. (The reference values are a little different from those above because this is for the femoral neck and not the total hip)
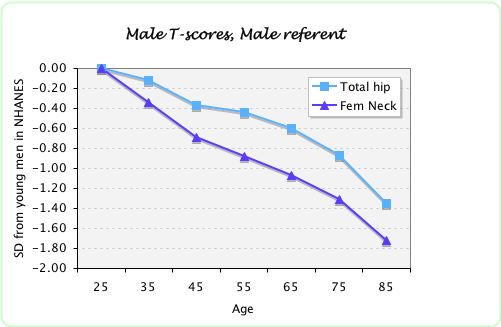
For older men, the T-score for the femoral neck will be lower than the T-score for the total hip. This graph shows the data from the NHANES study, using the young male values as the reference value. The graph shows the T-scores for average men. In other words, for all these points the Z-score is zero. For example, a 65-year old man with a T-score of -1.1 at the femoral neck would have the SAME risk of fracture as a 65-year old man with a T-score of the total hip of -0.6.
The graph shows the T-scores, calculated from young female reference values, for average men and women from a large meta-analysis (Johnell, ASBMR abstract 2005). 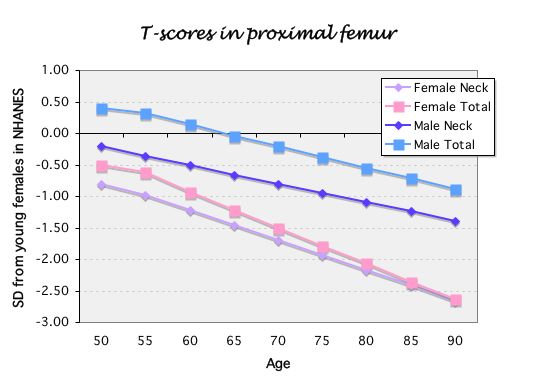
You must know the age, gender and race and skeletal site and have a reference table of average T-scores. The values shown here are all using race and gender references at the total hip from the NHANES database. This works because the standard deviations are about the same for all ages.
Examples: 85-yr-old white woman with T-score of -2.25 has Z-score of 0
65-yr-old white man with T-score of -0.3 has Z-score of +0.3
55-yr-old black woman with Z-score of -1 has T-score of -1.5
55-yr-old black woman with Z-score of +1 has T-score of +0.5
For 25-yr-olds Z-score and T-score will be the same. Otherwise the T-score is always worse than the Z-score. The exception is when weight is included to calculate the Z-score, which I think should not be done.
Neither one of these scores can predict the fracture risk unless you also know the age. Because the T-score and Z-score can be converted back and forth, you predict fractures equally with either one.
If a measurement has lower T-scores in older people, it could be due to a faster decline with aging (as in the case of QCT or femoral neck bone density). It also could be due to smaller standard deviations in the young population. The fracture rates go up steeply with age, so any test that is closely related to age will be able to predict that an older person has more fractures than a young person. But clinically we want to know whether the test can discriminate between those of the same age who will or won't fracture. So if a person has a QCT measurement 1SD lower than average for age (ie, Z-score of -1) her risk of fracture is quite similar to a person with DEXA Z-score of -1. The T-score of the QCT, however, will be much lower than of DEXA.
The standard deviations don't change very much with age, so the risk per SD will be the same using T-score or Z-score. The fracture risk, however, should be compared to a person the same age with a T-score of zero, not an average person.
This is approximately true for women, but not for men. The fracture risk per Z-score is similar for the femoral neck and the total hip, but the conversion formulas from the T-score at the total hip are not the same as those from the femoral neck.
Updated 7/29/2011