Bone density
Techniques
| DEXA
|
|---|
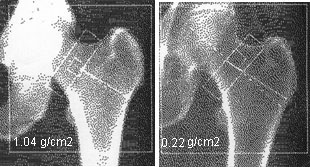
Several methods are available to measure bone density, but currently the most widely used technique is DEXA (Dual Energy Xray Absorptiometry). This is the method used to determine efficacy in the recent large clinical trials, and to characterize fracture risk in large epidemiological studies. Older methods such as single photon absorptiometry do not predict hip fractures as well as DEXA. Three companies manufacture these densitometers: Hologic, Norland, and Lunar.  Here are more details about reading bone density printouts. Here are more details about reading bone density printouts.
|
| Ultrasound
|
|---|
| Ultrasound measurements are usually performed at the calcaneous and it is not possible to measure sites of osteoporotic fracture such as the hip or spine. Ultrasound at the heel can predict hip fractures nearly as well as DEXA. Adding an ultrasound measurement to a DEXA does not improve the prediction of fractures. Although some have said that ultrasound measures the "quality" of bone, more careful studies suggest that it mainly measures the bone mass. This technique has not been used as often because there is not as much data about effects of medications. Recently ultrasound measurements have been included in the FRAX fracture prediction tool, and they can be used to predict risk of osteoporotic fractures.
|
| QCT
|
|---|
Quantitative computed tomography of the spine must be done following strict protocols in laboratories that do these tests frequently; in community settings the reproducibility is poor. Radiation exposure is greater than with the other techniques. The QCT measurements decrease more rapidly with aging, so in older individuals the "T scores" can be more than 2 units lower than DEXA measurements. There are some newer machines which may have better precision. This technique still does not have the large database that is available with DEXA. In May 2013 QCT measurements were added to the FRAX website and they can be used to estimate fracture risk.
Click to see table of T scores using the traditional QCT measurements compared to those using DEXA.
High-resolution peripheral QCT (HR-pQCT) can be used on the radius or tibia to study in detail the changes in the cortical vs. the trabecular bone. Currently these are only available in research centers.
|
| Other
|
|---|
| Older methods that can measure bone density at the hand, radius or ankle include single energy absorptiometry, metacarpal width or density from hand xrays. High-resolution magnetic resonance imaging of the tibia or radius shows promise for allowing a "virtual biopsy" of the bone and can non-invasively follow bone structural changes, but this is also currently a research tool.
|
Bone Density Loss with Aging
 This graph shows how the bone density of the total hip decreases with age. The units are standardized bone density in (mg/cm2). The lines show the average values, and for each age, race and gender a range of values occurs in the ordinary population (Looker)
 The bone density is important because it can help to predict the risk of getting a fracture. The fracture risk calculator can be used to predict fracture risk from the DEXA results.
Bone density results in teenagers was published by an international collaboration.
Here is a REFERENCE RANGE for CHILDREN by Kalkwarf.
Bone density results have been reported in a variety of ways that have been confusing to physicians and patients. The next sections will attempt to clarify these issues, such as T-score, Z-score and the redefinition of "normal".
T and Z scores
 T and Z scores are based on the statistical unit of the standard deviation. Shown here is the classical bell-shaped curve with the percent of a population lower than that value.
The T-score is the number of standard deviations below the average for a young adult at peak bone density. There are different T-scores depending on which group of young adults were used as the reference (for example, Caucasian women, Hispanic men).
The Z-score is the number of standard deviations below an average person of the same age. There are also different Z-scores depending on the group used as a reference (for example, the group could include everybody of the same age, or it could be limited to people with the same age, race, gender and weight). Furthermore, a person can have one T-score and Z-score at the femoral neck, another at the total hip, and another at the spine.
 Click to read more details about the relationships between T-score, Z-score and g/cm2, including conversion formulas, data tables and some of the misconceptions about the interpretation of the scores.
The WHO definitions
|
In 1994 the World Health Organization defined the following categories based on bone density in white women:
- Normal bone: T-score better than -1
- Osteopenia: T-score between -1 and -2.5
- Osteoporosis: T-score less than -2.5
- Established (severe) osteoporosis
includes the presence of a non-traumatic fracture.
The WHO committee did not originally have enough data to create definitions for men or other ethnic groups.
One standard deviation is at the 16th percentile, so by definition 16% of young women had osteopenia! (years later, the WHO and other groups recommended against using these definitions in people younger than 50). As shown below, by the time women reach age 80, very few are considered normal.
It is important to realize that the T-score alone does not predict fractures, and osteopenia is not a disease.
Since then, many studies have examined the relationship between bone density, race, gender, and other factors which predict a fracture. Instead of merely using terms such as "osteopenia" it is more helpful and informative to use the bone density and the other factors to predict the fracture risk.
|
Cutoff values for osteopenia using total Hip BMD
| T-score | Hologic | Lunar | Norland | Standard |
| -1 |
.820 |
.886 |
.800 |
833 |
|---|
| -2.5 |
.637 |
.706 |
.615 |
648 |
|---|
|
Percentage of US Caucasian women in WHO categories
| | Age 25 | Age 50 | Age 65 | Age 80 |
| Normal |
84% |
66% |
40% |
10% |
|---|
| Osteopenia |
15% |
33% |
40% |
35% |
|---|
| Osteoporosis |
1% |
1% |
13% |
27% |
|---|
| Established osteoporosis |
1% |
1% |
7% |
27% |
|---|
Updated 7/3/13, reviewed 2/10/16