HYDROLOGIC ANALYSIS Introduction This portion of the report describes the hydrologic analysis done as part of a bridge and culvert design project on the Little Washougal River. There were two objectives of this analysis: 1) derive a value for the "high water mark" that could be used in determination of bridge dimensions based on a 100-year event; 2) determine 100-year flows at a given location for culvert selection; and 3) determine 2-year flows at given location for subsequent culvert analysis. This report discusses the available data and their sources, the methods of calculating volumetric flow rates, methods of determining the "high water mark", and their strengths, weaknesses, and alternatives. The relevant information for this analysis came from the United States Geological Survey (USGS), the Western Regional Climate Center (WRCC), the open literature on local hydrologic activities, and Professor Susan Bolton of the University of Washington. The sources of this information can be found in the "References" section of the greater bridge-design report, under hydrologic data. The major conclusions that emerge from this analysis include:
The 100-year flood flow rates calculated for the bridge ranged from 340 cfs (Rational) to 2,340 cfs (USGS). For the culvert, the 100-year flow rate 5 cfs (Rational) to 250 cfs (Log Pearson) and the 2-year flow rate had a range of 23 cfs (USGS) to 104 cfs (Log Pearson). These values and their calculation can be found in the report body and linked spreadsheet under the "Methods" section. Of these values, the design flood or the 100 year event, we determined the Log Pearson value for the bridge, 2,025 cfs, to be most appropriate given the downstream gauge information and the USGS Regional value for the culvert, 64 cfs, (23 cfs for the 2-year average flow),. A discussion on how we came to this conclusion can be found in the "Discussion" section of this report. Background Our assignment was to design a bridge for the intersection of the MC Road and the Little Washougal River. The legal description for this location is T3N R6E the NE 1/4 of the SW 1/4 of the NW 1/4 of Section 18. We were to also design culvert for the intersection of the MC Road with Mine Creek, A Type 4 stream, about 14 stations up road from the proposed bridge location. The legal description for the location of these culverts is T3N R5E the SE 1/4 of the NE 1/4 of the NE 1/4 of Section 13. Our goal was to provide an initial evaluation and design for the Little Washougal crossing and design specifications for a culvert installation at Mine Creek. Discussion Design Parameters For the Little Washougal River crossing we were asked to design for a 100-year event. Our goal was to determine the "high water mark" for this event. For the culvert we were asked to determine volumetric flow rates for a 100-year as well as "average flow conditions" based on 2-year maximum flows. Calculations of smaller events (2-year) were used to determine the "normal" average depth and velocity for the culvert. Data The first step in this process was gathering all the necessary information (e.g., climate data, area, peak flows, etc.). Peak flow for the Little Washougal River was taken from the United States Geological Survey (USGS) stream gauge web site. Data was only available for a record of 17 years from 1951-1968. Table-1 illustrates the peak flow values on record at the USGS for the Little Washougal River: Table-1—Peak Flow data (USGS) for Little Washougal River.
Precipitation data was taken from the Washington Regional Climate Center (WRCC) web page. We chose to take values from the Wind River gauge rather than the Washougal gauge because it was more site similar to the watersheds of interest. Further discussion on this can be found later under "Methods." Table-2 illustrates the average annual precipitation value used in our analysis.
Table-2—Average total precipitation for Wind River used in project analysis WIND RIVER, WASHINGTON Period of Record General Climate Summary - Precipitation Station:(459342) WIND RIVER From Year=1901 To Year=1977 Precipitation Mean Annual= 99.69 inches The area of each watershed of interest was calculated using the GRID module of Arc/Info and a digital elevation model (DEM) derived from USGS and USDA Forest Service 7.5' DEMs. Essentially, the bridge and culvert locations were selected as cells in a GRID and using GRID surface hydrologic functions the area contributing to each site's volumetric flow rate was calculated. The area of the watershed contributing to the bridge was determined to be about 10.66 square miles. For the culvert it was about 0.163 square miles. The watershed for the gauge was 23.3 square miles. To determine the "high water mark" for these events cross-sectional survey data of the river was provided. The Manning's n, or roughness coefficient used for the Little Washougal River was .04, from a table in Physical Hydrology, Dingman, S. Lawrence. Methods To arrive at the most appropriate design the accuracy of your hydrologic analysis is crucial! Therefore, several (4) methods of calculating volumetric flow rate were utilized so values could be compared for quality. To calculate volumetric flow for these conditions we used:
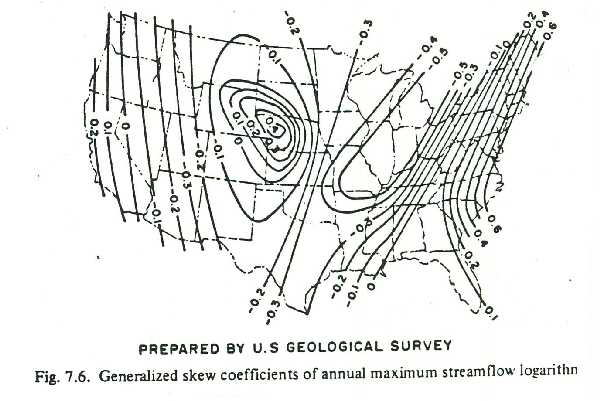
Log Pearson III: Log Q = Xbar + KS Where: Q= logarithm of discharge Q at selected exceedence probability. Xbar= mean of logarithms of annual peak discharges. K= a factor that is a function of the weighted skew coefficient Gw and the selected exceedence probability. S= standard deviation of annual peak discharge logarithms. To determine a discharge, Q (cfs), for a given event, this method uses peak discharges recorded from a stream gauge. The peak flows on record were dated from 1951 to 1968. These flows were then statistically analyzed for the mean (Xbar), standard deviation (S), etc. and used in the following information4 to determine Gw: G1= N2(S X3)-3N(S X)(S X2)+(2)(S X)3 N(N-1)(N-2)(S3) MSEG= 10exp{A-B[log10(N/10)]} A= -0.33 + 0.08 |G1|, if |G1|<=0.90 = -0.52 + 0.30 |G1|, if |G1|>0.90 B= 0.94 – 0.26 |G1|, if |G1|<=1.50 = 0.55, if |G1|>1.50 Gw= MSEGbar (G1) + MSEG (Gbar) MSEGbar + MSEG Where: Gw= weighted skew coefficient. MSEGbar= mean-square error of generalized skew.= 0.302 MSEG= mean-square error of gauging station skew G1= computed gauging station skew Gbar= generalized skew from bulletin 17B[14]
 Area Correction Ratio = [(Drainage area)^(1/2)]/[(Gauged Drainage Area)^(1/2)] We used this process to calculate flow rate values for 100-year and 50-year events at the bridge site. We also used it to calculate 100-year, 50-year, 10-year, and 2-year events at the culvert site. One possible source of error in using this set of data was that the stream gauge for the Little Washougal River was located further downstream, i.e., a larger drainage area and therefore a larger flow passing that point. Within the equation there is a correction factor that will interpolate the amount of water passing a point upstream of the gauge according to the different drainage areas. For the bridge site, this equation proved most reliable as it considers the stream flow that already exists and the history of the area in peak flows. This method proved unreliable for the culvert site. USGS Regional Regression Equation QR = aAb1(Pavg) b2F b3 Where: QR = the peak flow for recurrence interval R (R = 2, 5, 10, 25, 50, and 100 years) Pavg = the average annual precipitation in inches for the basin. F = the percentage of the unit normally covered by forest vegetation (i.e., 50% = 50). a, b1, b2, and b3 = regional variables taken from WSA manual3. The USGS equation was based on the watershed area, average annual precipitation, percent cover and regionally based constants. We determined our design site to be located in Region II. The precipitation data was gathered from the WRCC web site for Wind River, Washington. We chose to use the data from Wind River rather than from Washougal due to Washougal's close proximity to the Columbia River and its effects. Wind River was in a more mountainous area with similar characteristics to the design area. The precipitation for this area was an average of 99.69 in/year compared to 83.87 in/year given by the Washougal gauge. The calculation for the 100 year event using this method came close to the Log Pearson III equation, but other event sizes were not as accurate. Campbell & Sidle Q100 = (3.86x10⁻⁴) A0.46P1.78 Q50 = (2.03x10⁻⁴) A0.45P1.87 Q10 = (2.51x10⁻⁵) A0.44P2.15 Where: Qx = Flow in m3/s for return interval x (x = 100, 50, and 10 years). A = Drainage area (km2) P = Precipitation (cm) This method was extracted from a paper, by Alan J. Campbell and Roy C. Sidle (1984), called "Prediction of Peak Flows on Small Watersheds in Oregon for Use in Culvert Design." Hence, we appropriately refer to this method and the associated equations as the "Campbell-Sidle" method. The equations were derived from empirical data on Oregon watersheds. This method uses the watershed area in square kilometers, mean annual precipitation in centimeters, and constants based on regional (Cascade) empirical data that we felt was applicable to conditions at our site. In their study, Campbell and Sidle, sectioned Oregon into 6 regions. The region we felt was most similar to our site fell with what they termed the "Cascade Region." Therefore, when you look into this paper all the information we extracted pertains to just this region and not the others. We felt that this method gave us the more reliable volumes of water for the culvert site, but not for the bridge site as this was not what the equation was designed for. Rational Method Q = CIA The rational method calculates very irrational values we found. The variables for the equation included area, A, rainfall intensity, I, and a runoff coefficient, C. The rainfall intensity was determined from NOAA Atlases of depth and duration. The area is located on the map of isopluvials for a given intensity of inches per hour. The coefficient C is determined from the slope, terrain and soil characteristics. This method is very unreliable and only considers overland flow. Consequently, we won't go into detail about how to obtain a value.
Little Washougal:
The Log Pearson Type III Distribution seemed to give the most appropriate values for volumetric flow based on the gauged peak flow history. The Log Pearson method gave a value of Q100=2,025 cfs. For this flow the high watermark is at 11.21'. If we were to use the Q50 value of 1,827 cfs would it be possible to design our bridge site on Q50=1827 cfs? With a flow rate of 1,827 cfs the high watermark occurs at 10.71 feet. The difference in the two flows is a vertical distance of 1/2 of a foot. So, realistically, you could design for the 50-year event because of its similarity to the 100-year event. The USGS equation's estimate was very similar to the Log Pearson III, but this does not give it merit because the inputs into the equation are not based on known stream data which would is the best possible data to estimate the 100 year event. The following section outlines our methods for calculating the height of the water for the bridge design, given the volumetric flow rate for a 100-year event. Height or High Water Mark: The height of the 100-year flood in the Little Washougal River was calculated with two methods: Manning's equation and the Coordinate Method. Manning's Equation: Q = 1.49/n*A*R2/3*S1/2 Where, Q= the volumetric flow rate in ft3/s, cfs n = Manning's n, or the roughness coefficient A = the cross-sectional area R = the hydraulic radius, A/P, where P = the wetted perimeter S = slope Manning's equation was used to determine the height of the high water occurring during the 100-year flood by solving for A and R. The Manning's n coefficient chosen for the Little Washougal river was .04 from a table in Physical Hydrology, Dingman, S. Lawrence. The height, calculated from a generalized stream cross-section, was 13.44 feet from the lowest point within the streambed. Coordinate Method: A = 1/2[X1(Y2-Yn)+X2(Y3-Y1)+…Xn(Y1-Nn-1)] Where, A = the cross-sectional area X = the coordinate in the x-direction Y = the coordinate in the y-direction The coordinate method used the data from the survey of the Little Washougal's cross-section6. The weakness in using this method stems from having incomplete and generalized stream/floodplain profile information. The survey information contained points taken sometimes up to 75' apart. The result is a generalized profile. It also did not information far out in to the floodplain. We had to estimate a general slope from other maps and use this to supplement the available profile. The following is the stream profile: Figure-1 --stream profile at bridge using survey data and estimates for floodplain.
The point to the far left of the profile is an estimate from other maps. Everything else is derived from the survey data. To improve this method you could simply take shots at shorter increments and include information further out into the floodplain. We used a spreadsheet to do the actual calculations (see attached spreadsheet). What we did was calculate areas assuming a flat horizontal surface represented the watermark. We kept raising the level until the area equaled the volumetric flow rate we chose as the best (2,025 cfs). Once this value was reached, we could determine the height to the watermark from the profile. The height calculated using the coordinate method was 11.21 feet from the lowest point within the streambed. We chose to use this height for the design of the bridge because the quality of the data for input was better than the generalized cross-section used in Manning's equation.
Mine Creek: All of the Q-values were attained using the outlined hydrology equations above. We needed to determine a culvert diameter that would pass a volumetric flow rate for the 100-year event. We also needed to determine the "average" flow occurring in the culvert based on a 2-year event. The only method that would calculate a volumetric flow rate for this small event was the USGS Regional method. To be consistent, we chose to use the corresponding 100-year Q from the USGS Regional method to design our culvert diameter. These values were Q100 = 64 cfs and Q2 = 23 cfs. Back to outline
|