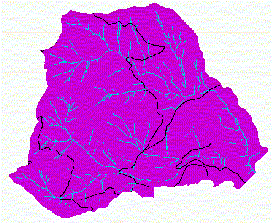
WETLANDS LAYER
Hoodsport Wetland Data Coverage Creating a wetland coverage is a bit more challenging than creating a streamline coverage. After some discussion, it was decided that wetland identification should be based on soil characteristics, landsat data, RIU vegetation data, and topography. Once the wetland polygon coverage has been created using GRID analysis techniques, the locations of wetland polygons will be checked by computing the distance from each wetland polygon to the nearest water source (stream, lake, Puget Sound). This will ensure that wetland locations are reasonable, that is, not located on ridge tops or in the middle of arid deserts. Finn, our instructor, has suggested using stacks, a GRID method of multivariate analysis (spatial statistics), to test for correlation between identified wetland regions on different data layers. For example, using stacks, we could produce scatter plots to examine the degree of correlation between wetland-indicator variables and flow accumulation. Wetland polygon coverage can also be compared with the orthophoto image. Many wetland areas are visible on the orthophoto. They show up as light gray areas on a background of darker gray. Soils Permeability values and descriptions have been compiled for each soil type found in our project planning area. A soils wetland-indicator grid will be created based on any available soils data that may indicate the presence of wetlands. For example, puddling potential, water capacity, percolation rate, drainage, percent composition of clay or organics, etc. With a Value Attribute Table (VAT), a single grid can represent a number of different soil attributes. Using a VAT will save disk space and should make computations in GRID more efficient. Landsat image Multispectral analysis will be used to create three types of wetland-indicator grids: the Normalized Difference Vegetation Index (NVDI); and the tasseled cap indices of wetness and greenness (see Phil Hurvitz's GIS lecture notes: Introduction to Remote Sensing). 1. NDVI is often referred to as the greenness index. It is derived from the reflected solar radiation in the near-infrared (NIR) and red (RED) wavelength bands via the algorithm: NDVI = (NIR - RED)/(NIR + RED) ( [Lan4] - [Lan3]) / ([Lan4] + [Lan3] )
NDVI values vary with absorption of red light by plant chlorophyll and the reflection of infrared radiation by water-filled leaf cells. The more developed the vegetation, i.e. the greener the vegetation, the higher the value of the NDVI. 2. Tasseled Cap Indices: Greenness is a contrast between near-infrared and visible reflectance and is thus a measure of the presence and density of green vegetation. ( [Lan1] * -0.2728 + [Lan2] * -0.2174 + [Lan3] * -0.5508 + [Lan4] * 0.7221 + [Lan5] * 0.0733 + [Lan7] * -0.1648) Wetness is a contrast between shortwave-infrared (SWIR) and visible/near-infrared (VNIR) reflectance, providing a measure of soil moisture content and vegetation density. ([Lan1] * 0.1446 + [Lan2] * 0.1761 + [Lan3] * 0.3322 + [Lan4] * 0.3396 + [Lan5] * -0.621 + [Lan7] * -0.4186) Individual bands may also be effective indicators. Finn suggests using band 4 to identify deciduous vegetation. RIU The RIU coverage is stand data. There may be data contained in this coverage that may aid in identifying wetlands. For example tree species such as vine maple and alder and shrubs such as devils club usually indicate moist environments. Unfortunately, the resolution of data in the RIU is rather pore. Luke is currently working on compiling the more site specific plot inventory data for our use. Topographic characteristics GRID surface functions will be used to identify topographic wetland indicators such as sinks, low gradient areas, and areas where flow accumulation is high but stream power is low. Finn has also suggested generating the groundwater profile and finding areas where it intersects or comes close to the surface topography. This is beyond my level of GRID expertise at the moment but perhaps I will work up to it. Approaches There are several possible approaches that could be taken in creating a wetland coverage. One approach is to come up with threshold values for wetland identification for each indicator grid, use CON functions or IF statements to choose 'wetland' cells in each grid. Then merge the all the cells to create a final integrated wetland grid. This would identify the largest potential area of wetlands. This method would likely produce a grid with value = 1 for wetland cells and value = 0 or 'no data' for non-wetland cells. Another approach could be to use grid algebra to create a 'wetland potential' grid based on soil and vegetation data, topographic classification, and landsat analysis. This approach would be more discriminating and this type of grid could be classified, which might help in creating a 'sensitive area' map and with prioritizing sites for field verification. The value for each cell in the wetland grid would be derived from the values of the corresponding cells in each 'wetland indicator' grid. The higher the value, the more likely it would be to find a wetland in that location. Verification Once a wetland grid has been created, it can be checked and verified with the hydro layer, the orthophoto, and with scatterplots and histograms created using stacks.
|
