 By Susan Seaberg
By Susan Seaberg
The Mass Wasting module will estimate the possibility of a hill slope failure and whether the sediment will be delivered to the stream network. Mass wasting or landslides occur naturally in every environment, although some may occur prematurely due to human activities. The objective for this module is to locate areas where landslides are more probable to occur and isolate the factors that may attribute to early activation of the mass wasting events. Many factors can be attributed to landsliding events including the internal properties of the soil structure, vegetation, topograhy and water.
 |
The soil structure is based on how the soil was formed. Soils are decomposed materials and disintegrated rock of many different mineral compositions. This mixing of components will give each soil type a structure that will enable the particles to hold together yet allow some water and air to pass.
The analysis for the mass wasting was performed by writing an analysis program for Grid in Arc/Info using the Arc Macro Language (AML). The mass wasting aml created was used with the soil coverage, dem and stream layer. Figure 1 shows the dem with the stream coverage atop.
The mass wasting analysis that was conducted included the use of three different methods: the Shaw Johnson method and Infinite Hillslope equation. The Shaw Johnson method analyzes the mass wasting hazards using the curvature of the land surface and the steepness of the slope. The Infinite Hillslope equation is a more complex analysis based on the slope, soil properties including cohesion, saturated unit weight and the internal angle of friction, soil thickness, saturated soil thickness and root cohesion.
Shaw Johnson
The Shaw Johnson method utilizes the concavity of the topography in combination with the local slope in determining areas of mass wasting hazards. Table 1 explains the relationship of the inputs with respect to the rating output.
|
|
|||||
| Curvature |
|
|
|
|
|
| CONVEX |
|
|
|
|
|
| PLANAR |
|
|
|
Yellow |
|
| CONCAVE |
|
|
|
|
|
This method was used in the Hoodsport watershed analysis to locate general areas of mass wasting hazards. Due to the analysis using only two variables for prediction, this method should not be the only possibility in hazard ratings.
Infinite Hillslope
The Infinite Hillslope Equation is a better analysis of mass wasting potential. This equation utilizes more variables that are more closely attributed to landsliding events. These variables include the soils properties, soil depth and saturated depth as well as local slope and vegetation. The outcome of the Infinite Hillslope Equation is a factor of safety that can be used to estimate the potential for failure. The factor of safety is essentially a ratio of the resisting forces within the soil to the downslope forces. A factor of safety < 1 will identify those slopes that are more likely to fail than slopes with a factor of safety > 1. The equation is:
where, FS = Factor of Safety
Cs = the Soil Cohesion
Cr = the Cohesion due to Roots
q0 = the Surcharging Weight of Vegetation
h = the Soil Thickness
gsat = the Unit Weight of Saturated Soil
gw = the Unit Weight of Water
z = the Saturated Soil Thickness
f = Soil Friction Angle
q = the Slope
When this equation was used in the analysis, many of the variables were not singular values but a range of values for certain variables. With the soils layer that we received from the DNR, many of the variables were not included and the soil descriptions were very vague. As I mentioned in the Soils section of the Hoodsport Watershed Analysis, many of the properties were estimated for a range of values. Using the ranges of values for many of the variables a series of mass wasting potential grids were created. During the analysis of the factor of safety grids some variables were manipulated, some were controlled and some were held constant. Table 2 is a summary of the variables and their roles in the analysis.
|
|
|
|
|
|
|
|
|
|
|
|
|
|
|
|
Eighteen grids were created for the analysis. Six grids were created for the using the minimum values in the above table, six grids were created using the maximum values and six grids were created using random variables within the variable range for the miniumum/maximum values and the systematically varied values.
Two additional grids were created for the average of the eighteen grids created. One of the grids used an integer average and the other used a floating point average. The difference between these two grids is that the failing areas on the integer grid were areas that failed in all eighteen grids while the floating point average grid creates a range of failure based on how many times that area failed in the eighteen grids.
The delivery of potential mass wasting events to the stream network was estimated based on the soil's internal angle of friction. We estimated that a mass wasting event would stop if it reached a slope that was half as steep as the internal angle of friction. Any streams that were located within the area of non-stopping slopes were more likely to transport the sliding soil mass further downstream if a failure was to occur then streams located within stopping slopes.
The mass wasting hazards were estimated using two methods, the Shaw-Johnson approach and the Infinite Hillslope equation. The Shaw-Johnson method utilizes the slope and the curvature of the land surface and provides an initial estimate for areas of mass wasting hazards. The Infinite Hillslope equation is a more complex analysis using many specific soil properties including the saturated unit weight, internal angle of friction and soil cohesion, the soil depth, saturated soil depth, root cohesion, surcharging weight of vegetation and the slope providing a better estimate for mass wasting potential.
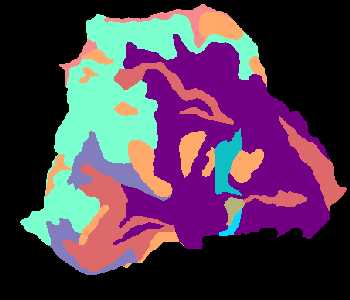
Figure 2. is the output for the Shaw Johnson covering the project basin within the Hoodsport watershed, green areas are more stable, yellow areas have a moderate hazard rating and red areas, located where the slopes are much steeper and more concave, are the areas of greatest mass wasting hazards.
 |
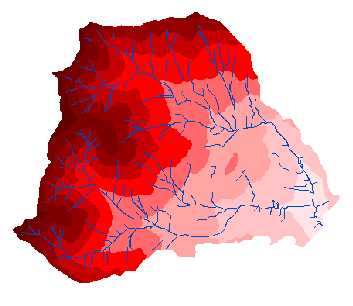
The Infinite Hillslope equation was used for a better estimate of mass wasting probability. Eighteen grids were composed for the analysis. Six were created using minimum values, six for maximum values and six created using random values within the range of each variable. Once all of these were created, two average grids were made. One average grid was an integer average and the other was a floating point average. The integer average grid, figure 3, shows the areas where failures occured in all eighteen grids, while the floating point average, figure 4, shows the range of failures. In the floating point average grid, darker red areas failed in more of the grids than the lighter red areas where failures may have only occured in a few grids. The areas with no color were rock outcrops located within the basin. These areas were taken out of the analysis leaving islands where no mass wasting would occur.
|
Figure 3. Factor of Safety integer average grid. Areas in red failed in all eighteen factor of safety grid. |
Figure 4. Factor of Safety floating point average grid. Areas in red failed in the eighteen factor of safety grids created. The darker red areas failed more than the lighter red areas. |
If a mass wasting event were to occur, a logical question would be what would it affect? We estimated that if a mass wasting event were to occur, it would stop if it encountered a slope htat was half as steep as the soils internal angle of friction. Figure 5 shows the areas where mass wasting would stop (red) and areas where they would not stop (green).
 |
Based on these stopping slopes, the streams that would be affected were located. If a stream was located in a non-stopping area, it was assumed that if there was a mass wasting event that occured in the proximity of the stream it would be delivered to the stream network and transported downstream. Figure 6 shows the areas of the streams that would be potential delivery sites of mass wasting events.
|
Utilizing the stream locations within the delivery areas and incorporating the mass wasting potential enables the creation of potential a potential mass wasting delivery grid, figure 7. This grid analyzes the mass wasting zones within proximity to the stream network for potential delivery.
|
Further analysis for the mass wasting delivery potential led to the grid of mass wasting accumulation into the stream network. Figure 8 accumulates the potential for mass wasting to occur through the stream network.
|
Areas where more mass wasting occurs impacts the streams by increasing the sediment delivered down the streams.
Within the basin of analysis, there are not many areas where landsliding will be an imminent problem. The areas prone to any mass wasting events occur in the steeper slopes of the basin where human activity will most likely occur in the more distant future.
Dunne, Thomas and Leopold, Luna, Water in Environmental Planning, Freeman and Company, New York, 1978
United States Department of Agriculture, Forest Service, Level I Stability Analysis (LISA) Documentation Version 2.0, April 1992
Official Soils Series Descriptions-USDS-NRCS Soil Survey Division
Soil Texture Triangle: Hydraulic Properties Calculator
Krogstad, Finn, Personal Interview, February to March , 1999