CTD
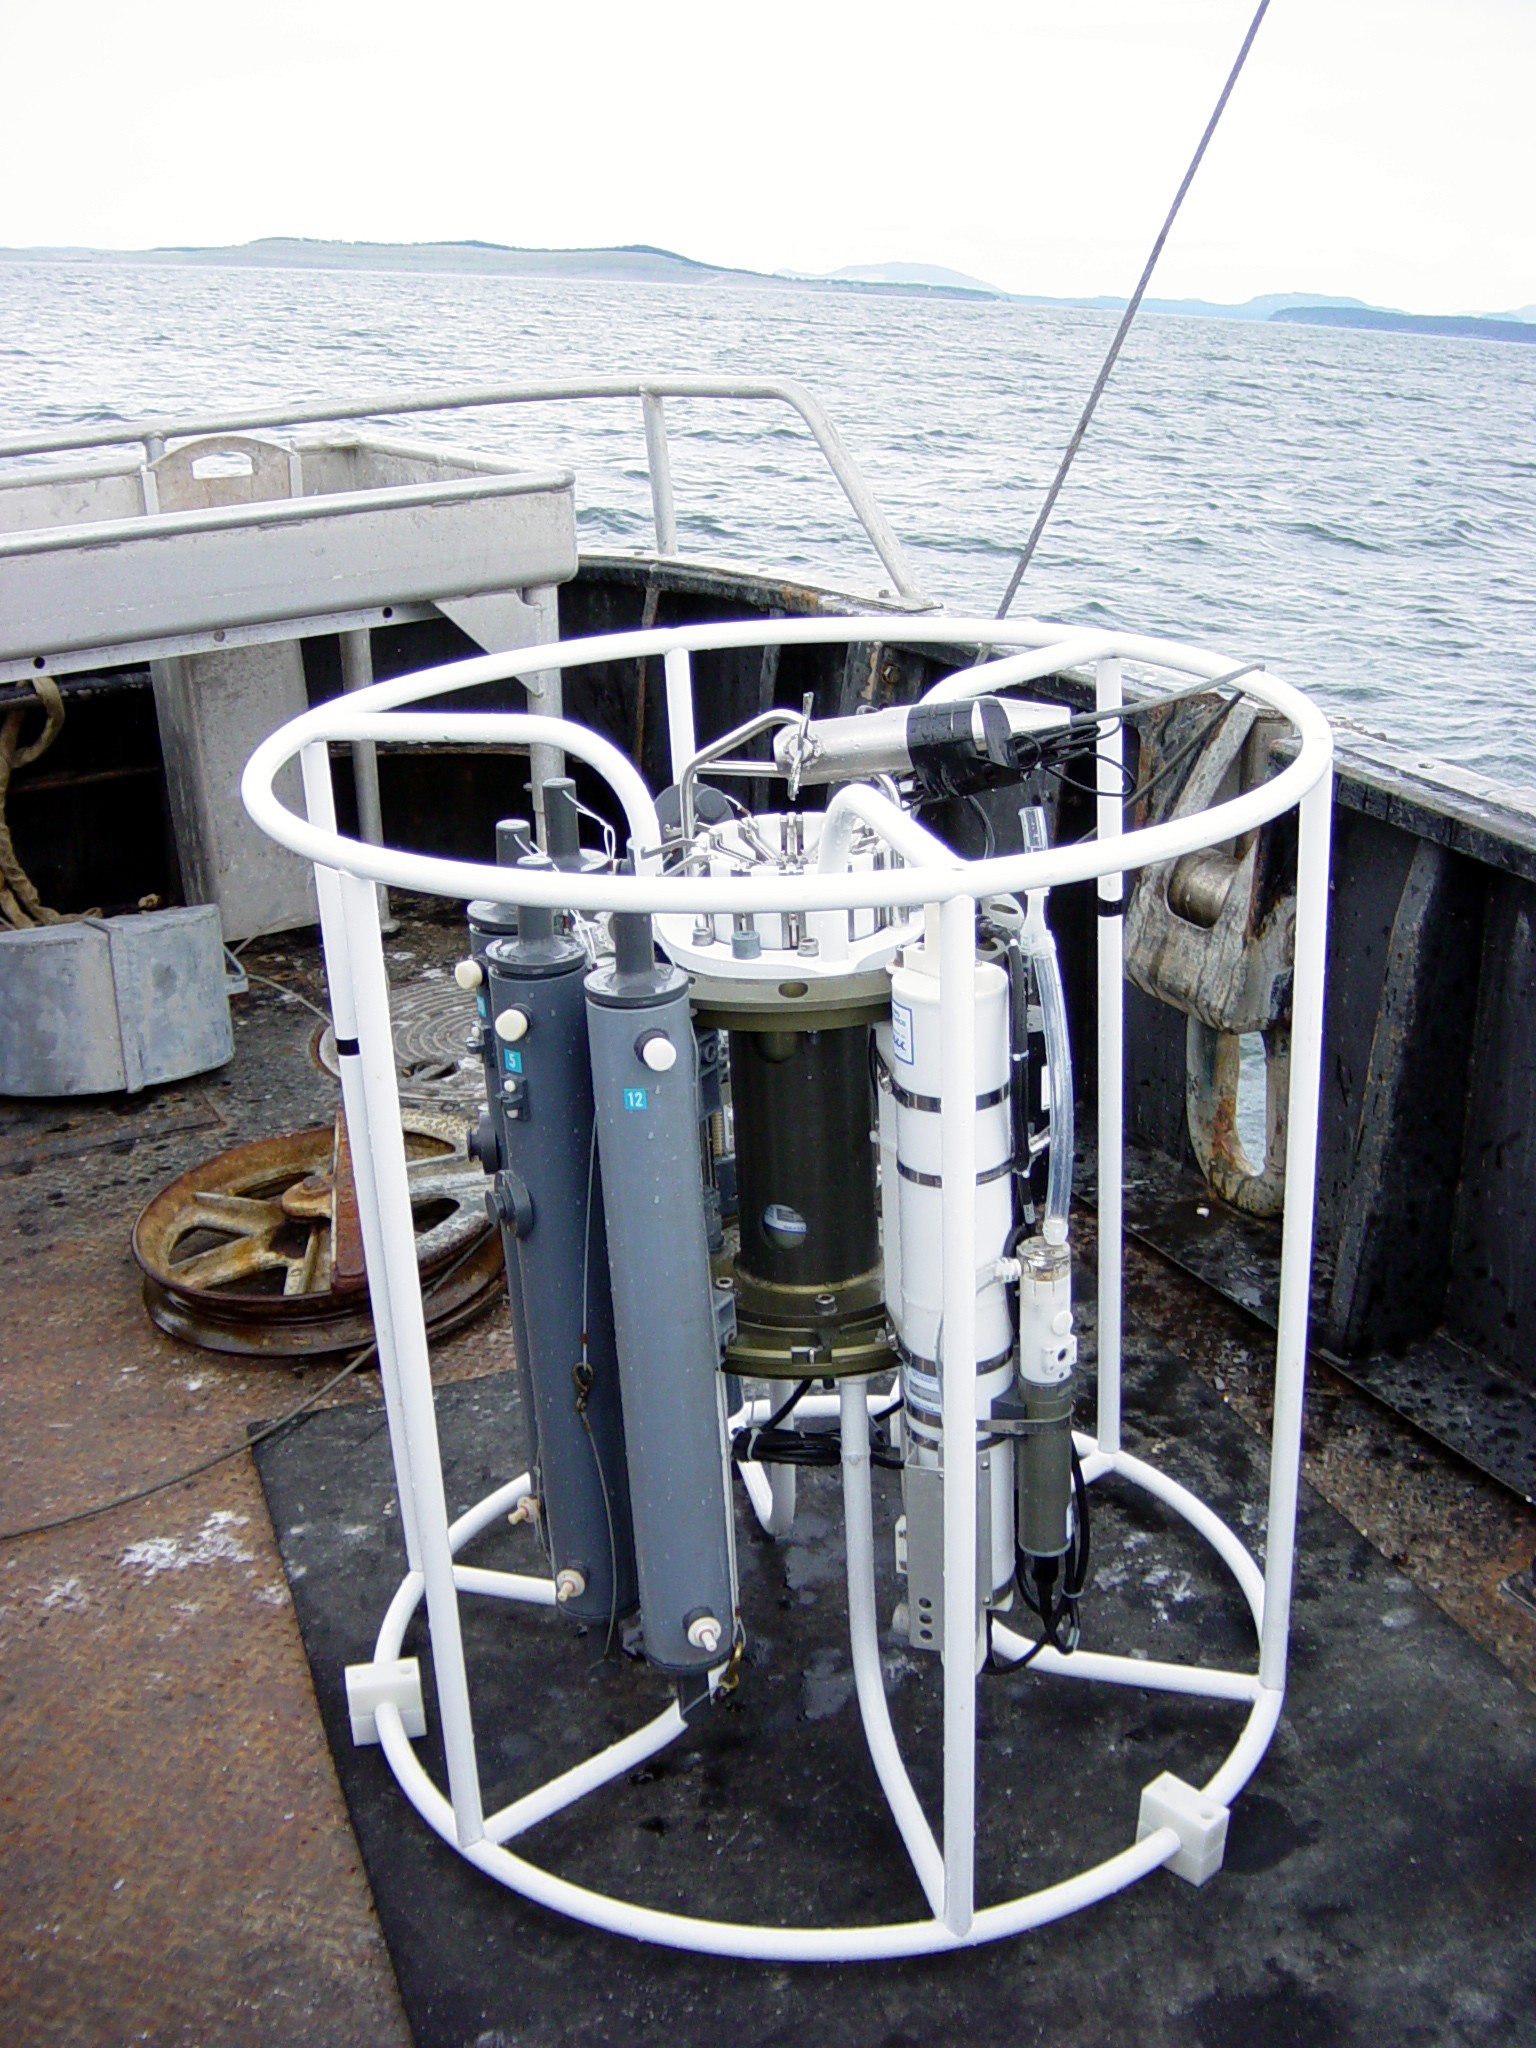
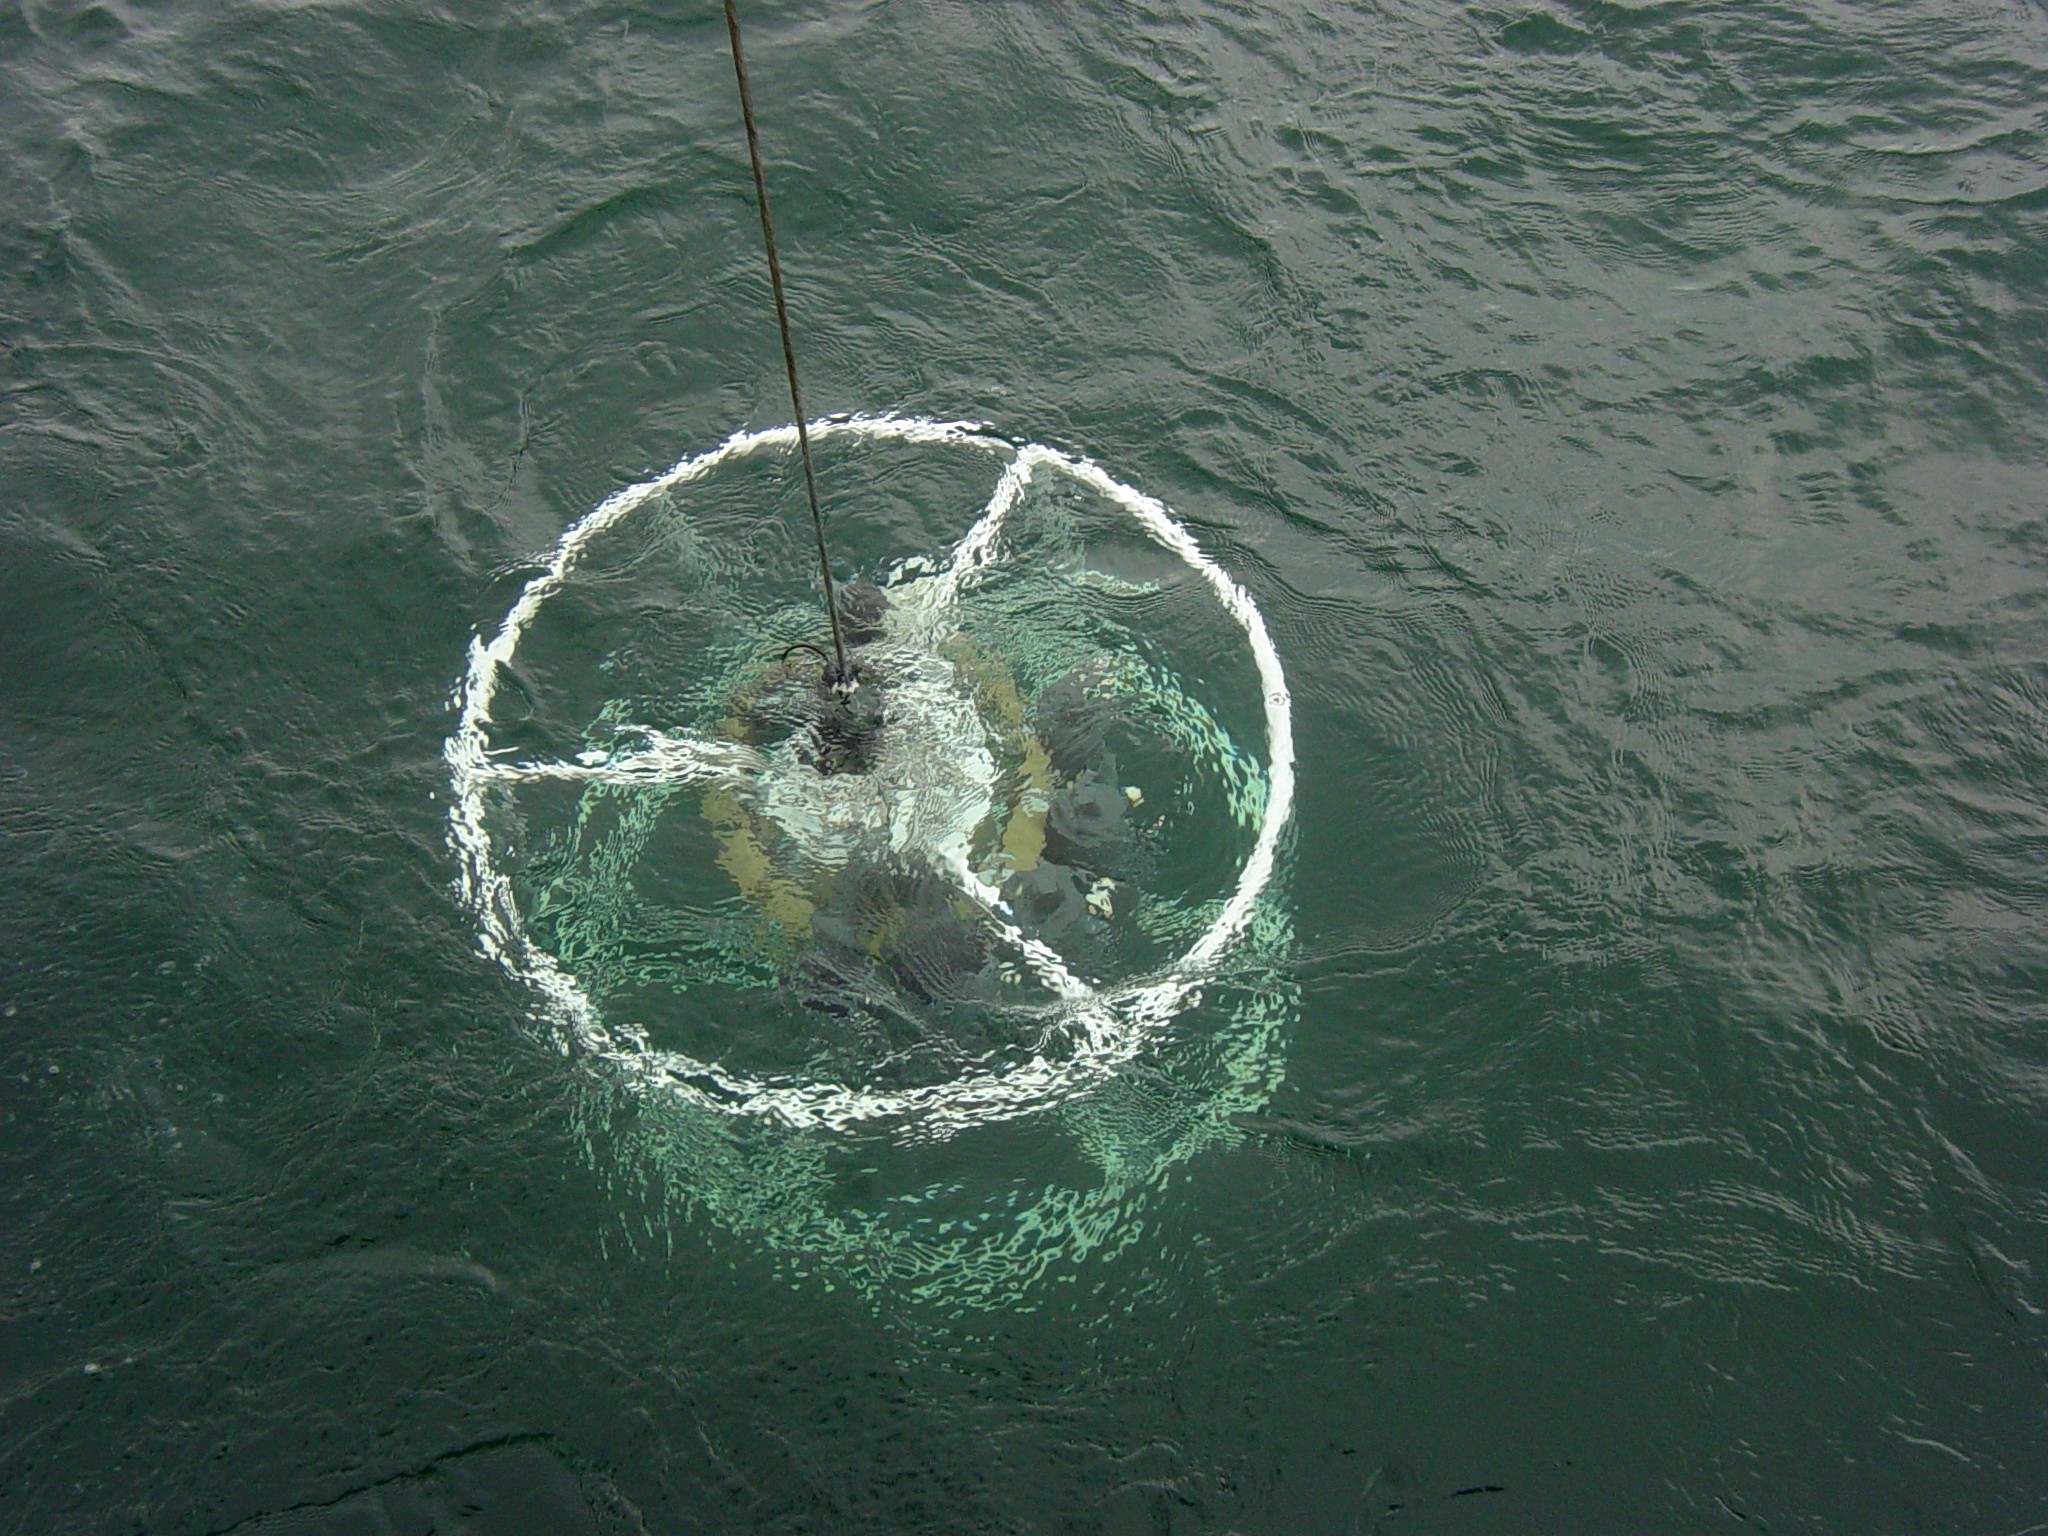

- The Conductivity Temperature and Depth (CTD) was lowered in predetermined locations. The data we analyzed from the device was temperature, salinity, density, dissolved oxygen, fluorescence, transmittance. Data was downloaded to a computer and processed for analysis.
Niskin Bottle
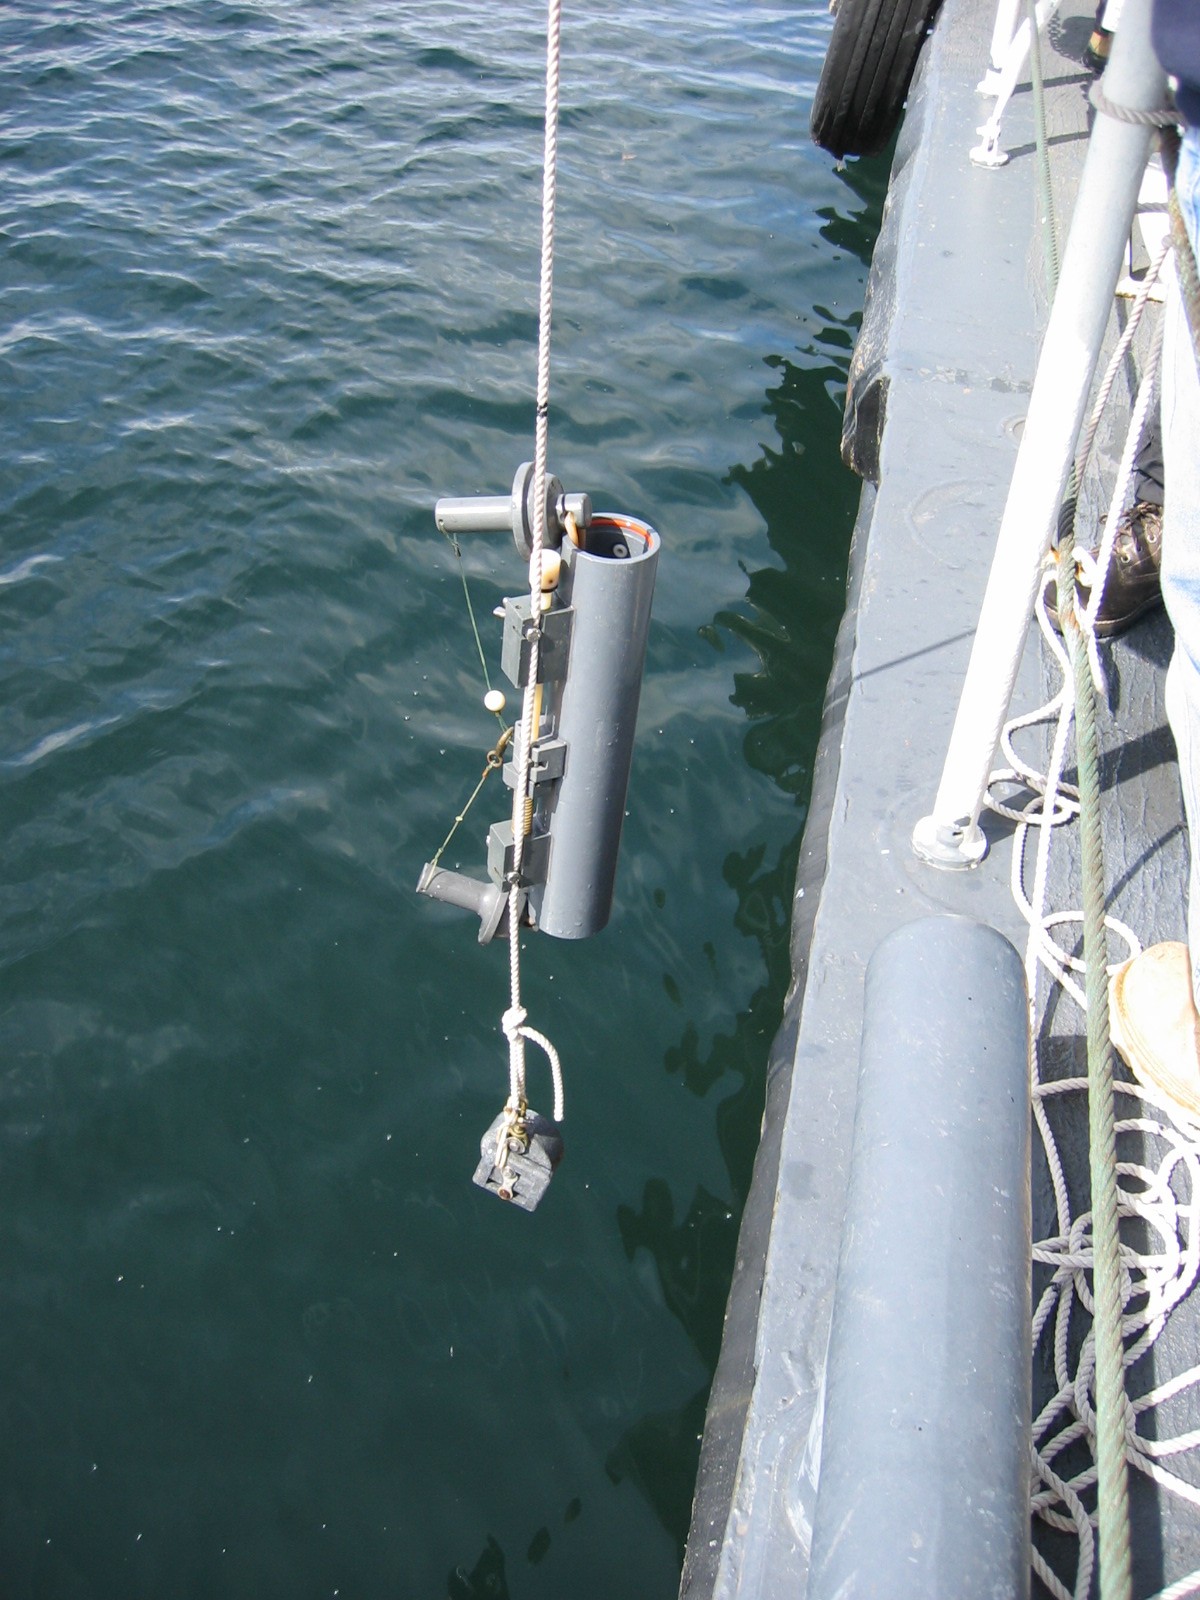
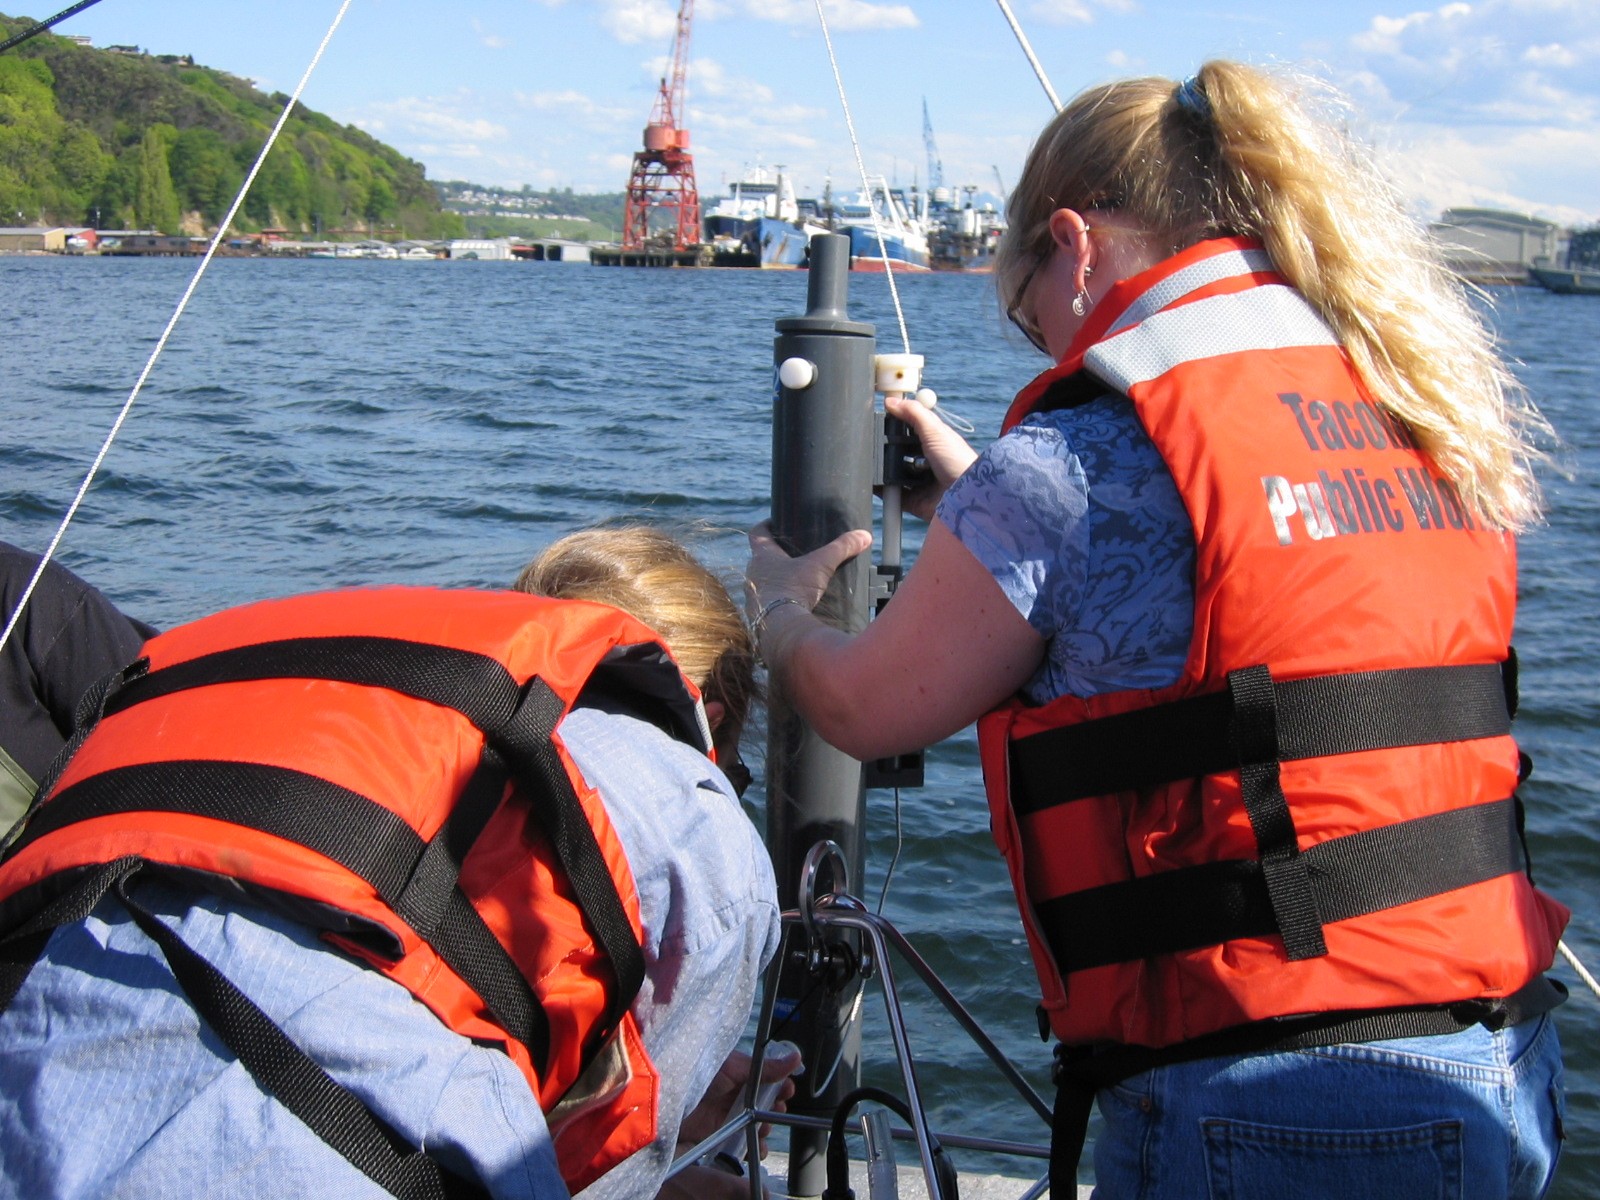
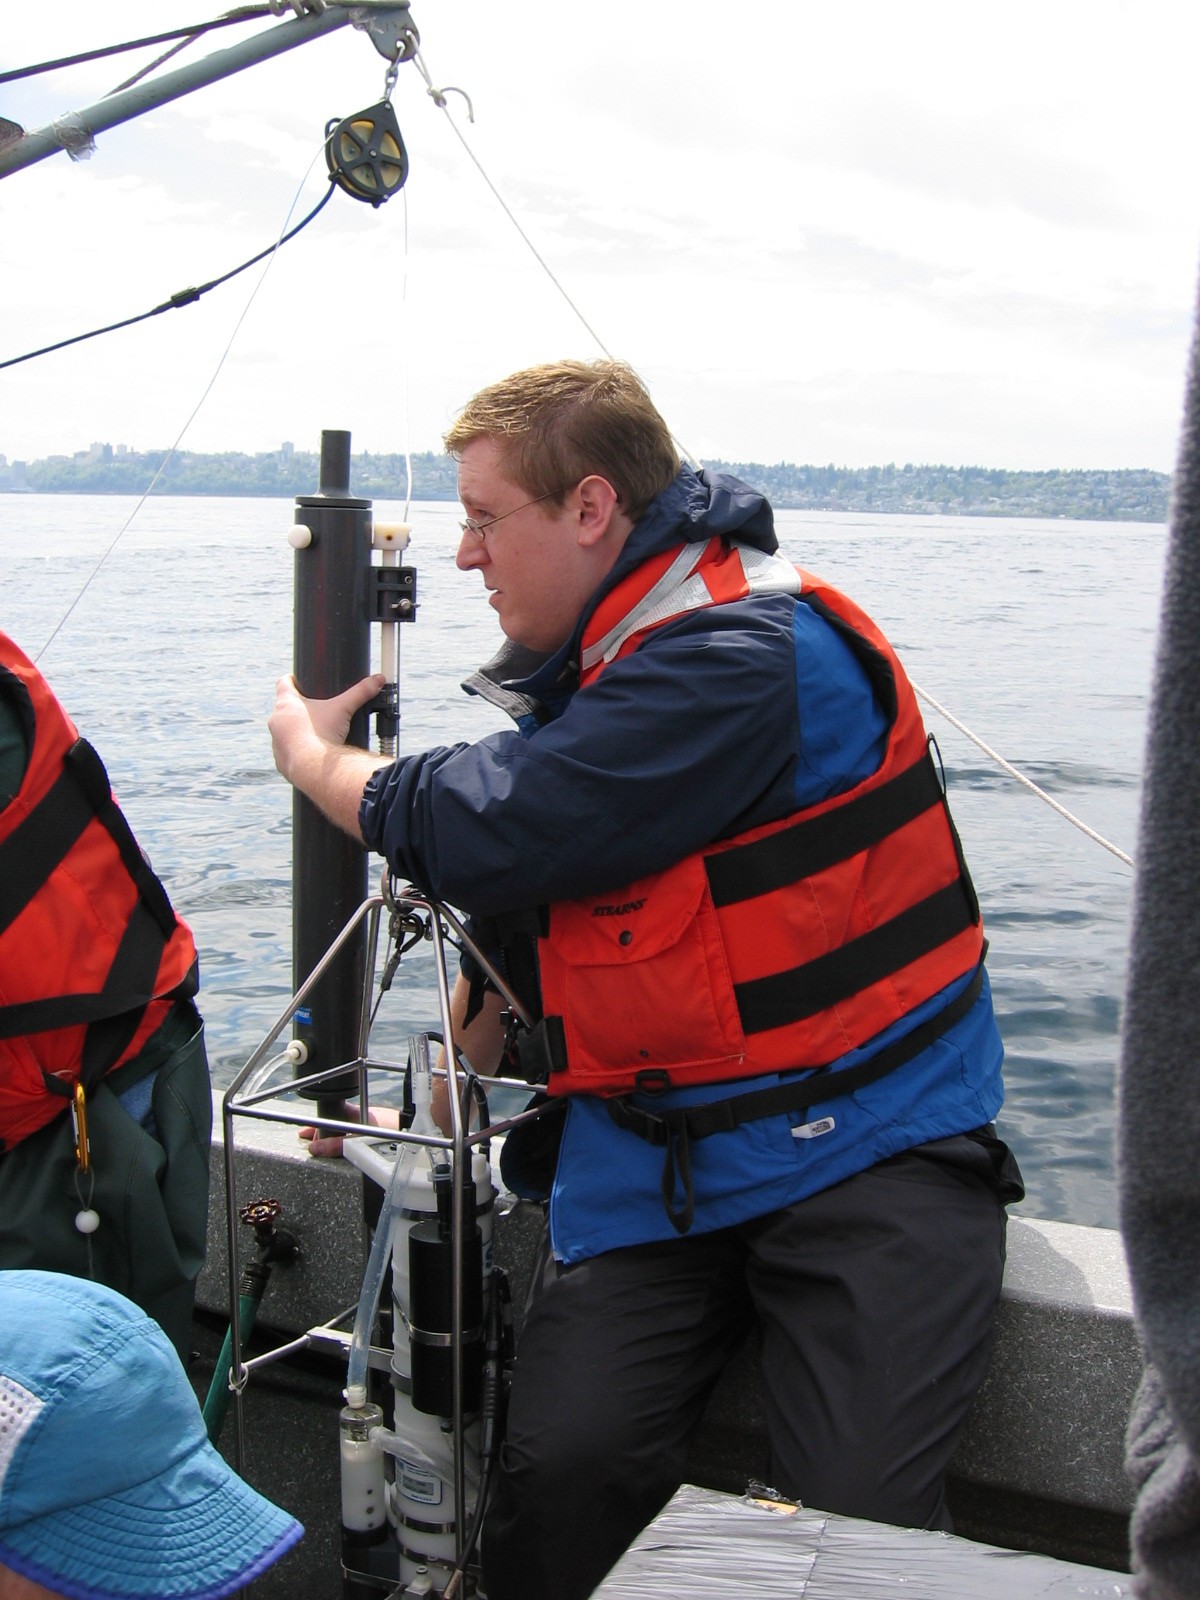
- The average Niskin bottle we used was 2.5 liters. We attached the bottles to a line that was typically lowered with the CTD to retrieve surface and depth samples. The bottles were closed using a messenger, which is a metal weight, and brought to the surface. Water samples were extracted for dissolved oxygen, chlorophyll, nutrients, and plankton.
Dissolved Oxygen Sampling
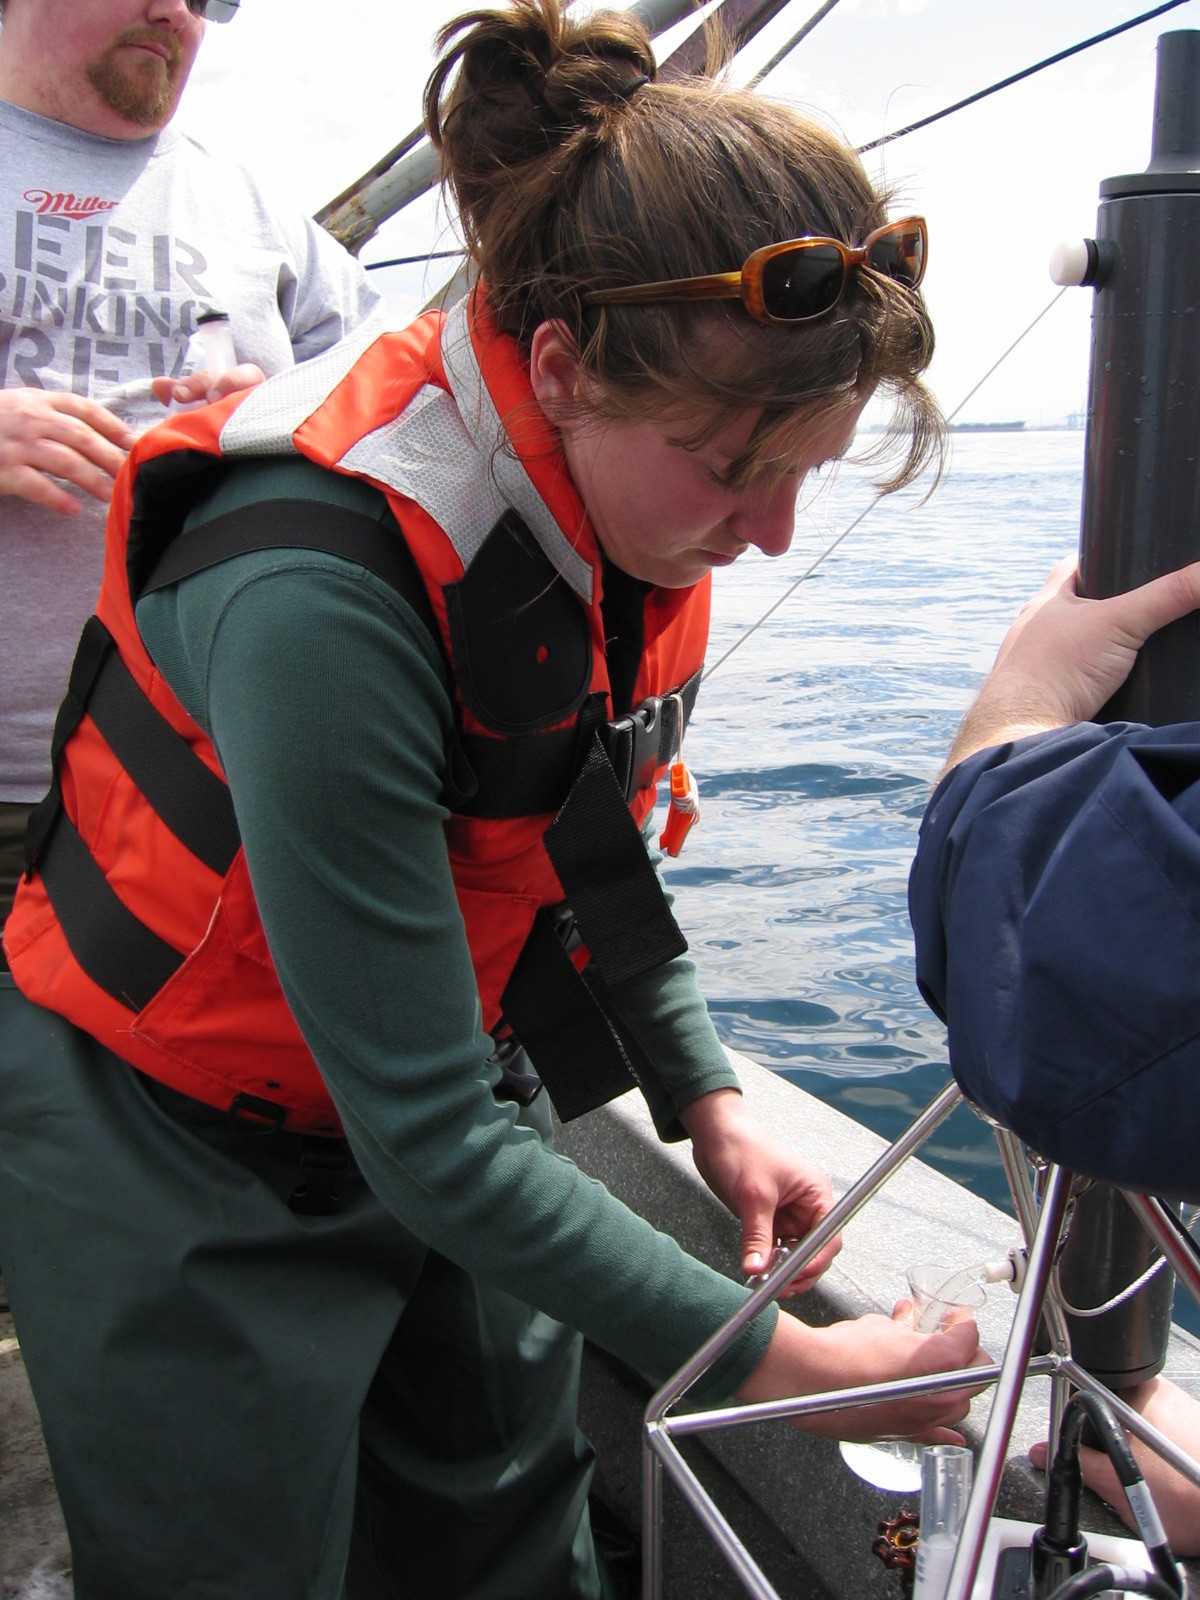
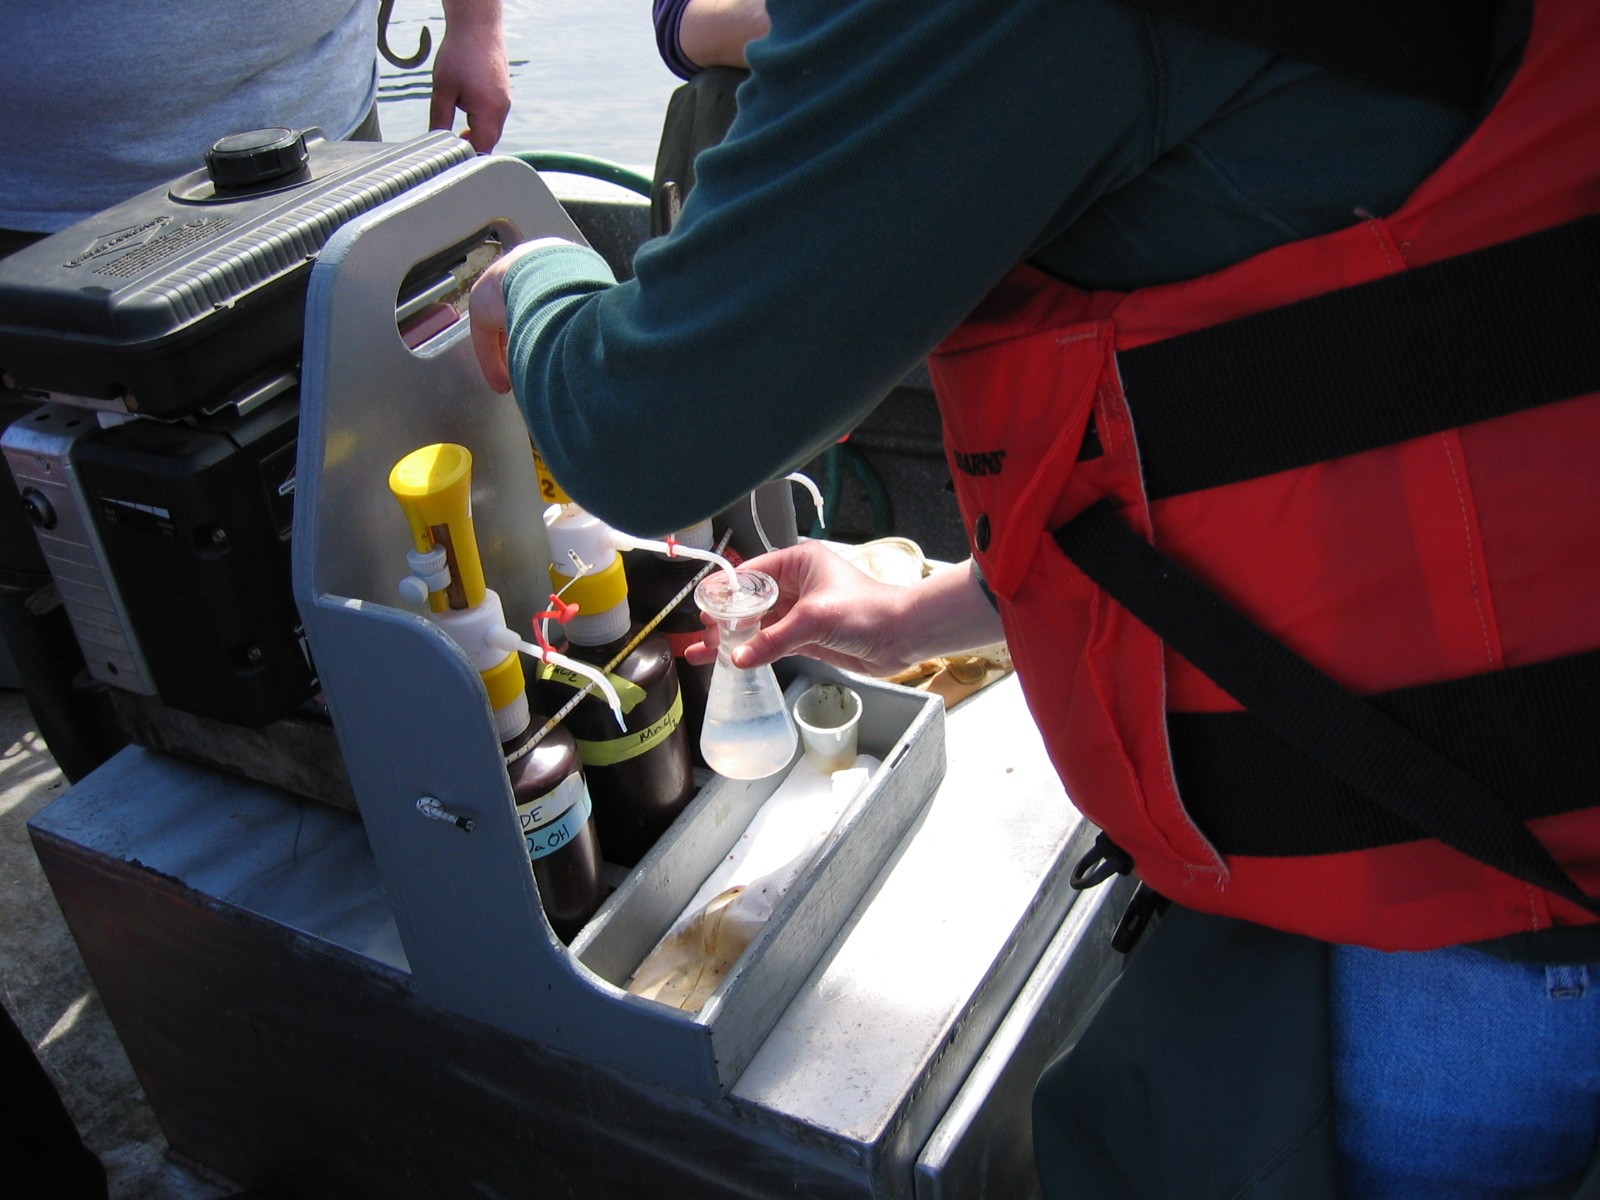

- Dissolved oxygen samples were fixed on the boat in 250ml glass bottles. The samples were fixed using 1mg of MnCl2 (Manganous Chloride) and 1mg of NaOH-NaI (Alkaline Sodium Iodide). The samples were inverted to mix the chemicals. Due to the possibility of undesirable photochemical reactions, we kept the bottles in a dark enclosed box until titration in the lab.
Winkler Titration

- In the lab, the oxygen samples were inverted again and titrated using the Winkler Titration Method. (Carpenter, 1965) A 250ml sample bottle sample was stirred while adding thiosulfate until the sample turned from a straw yellow to a pastel yellow. At this point, 1ml of starch was added and the sample turned a dark shade of purple. The thiosulfate was then slowly added until the sample turned clear and the endpoint titration number was recorded.
Chloropyll Sampling
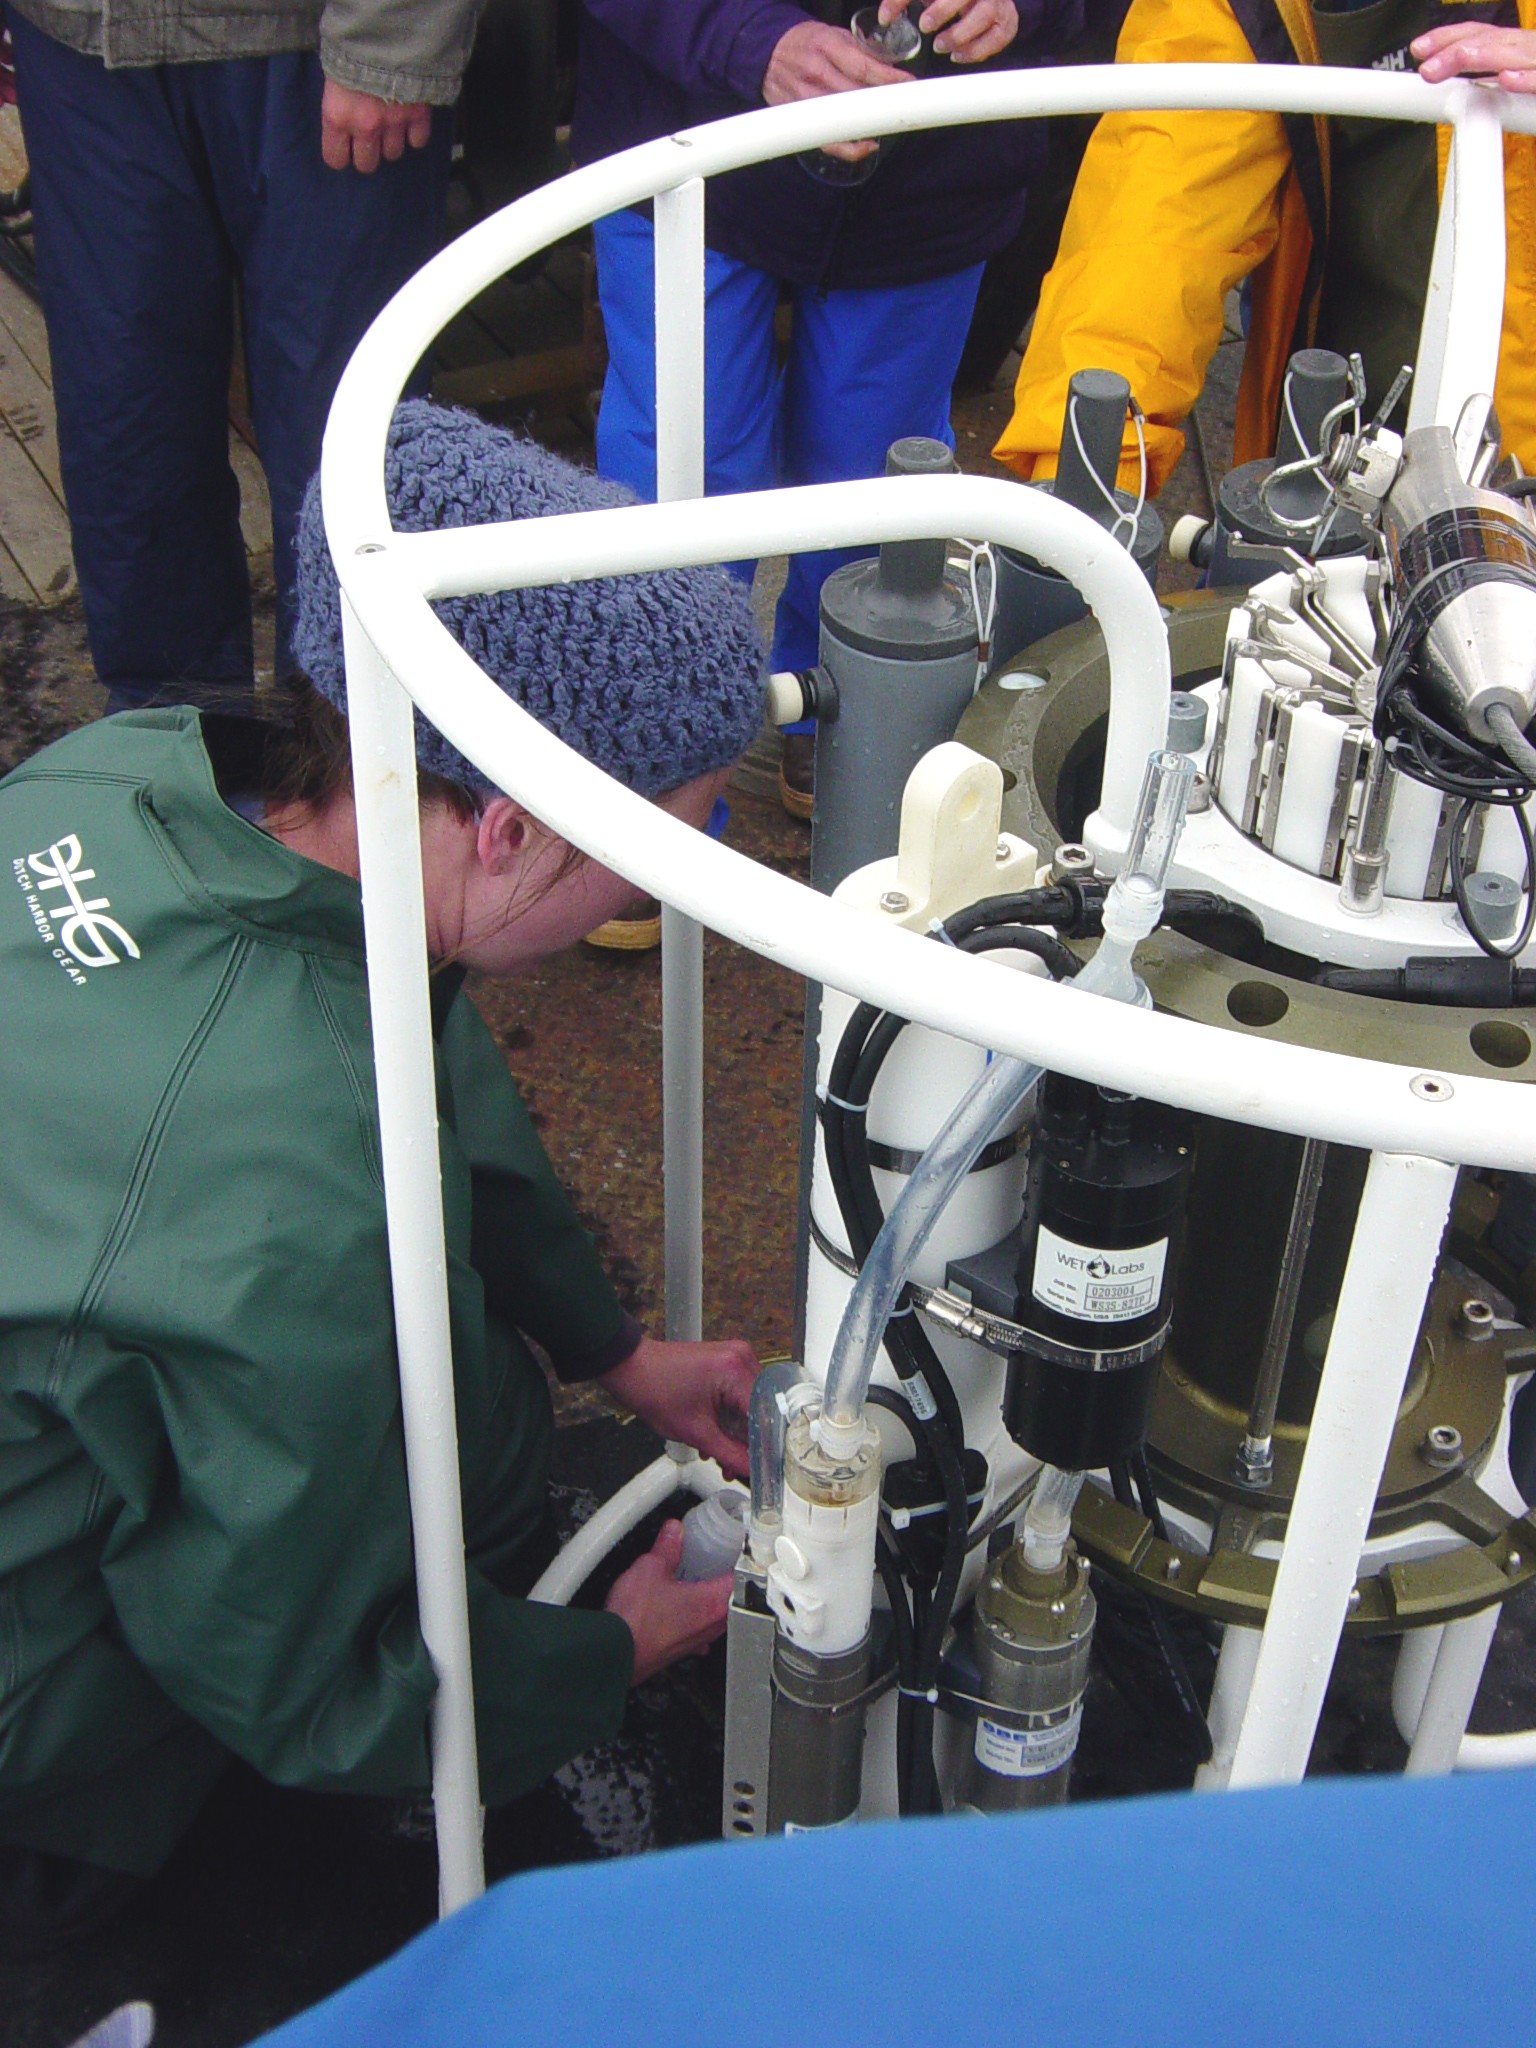
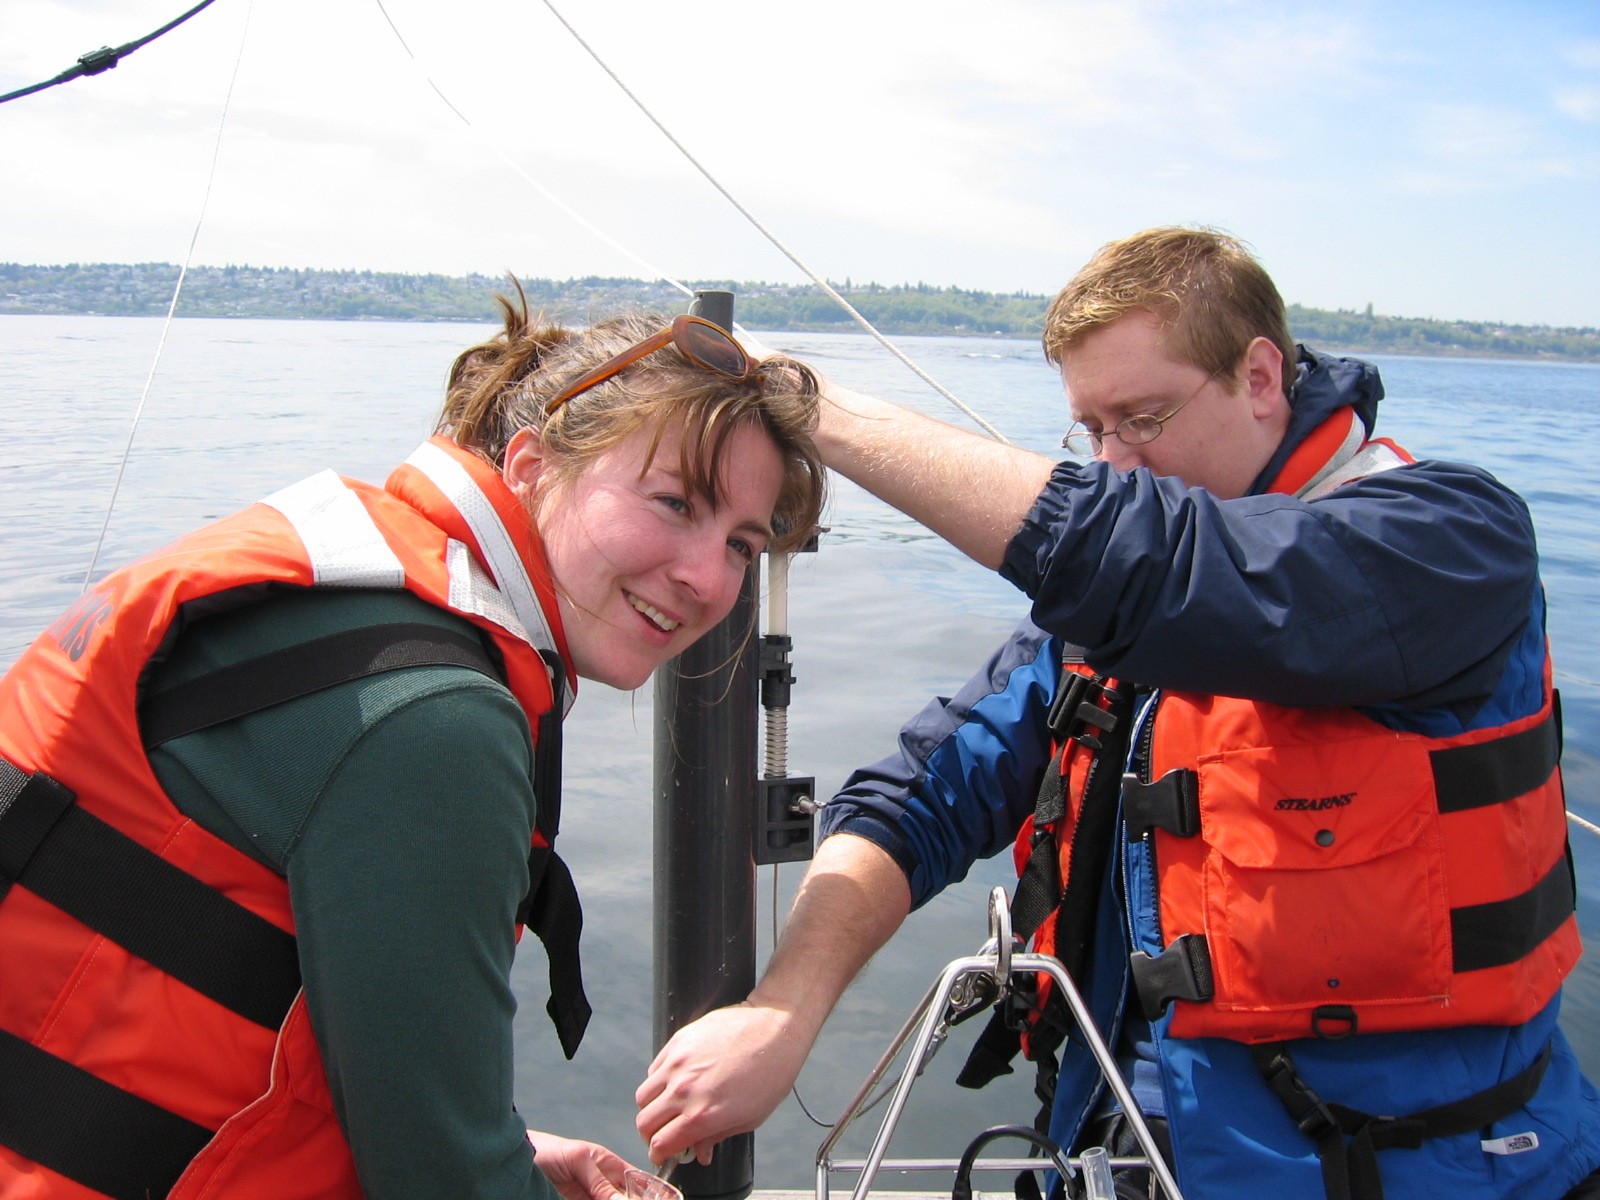
- After the oxygen samples were collected from the Niskin bottle, the chlorophyll samples were taken. The 125ml bottle was rinsed three times then filled to the top, which, on average, was 145mls. The samples were then kept on ice in a cooler until processed in the lab.
Lab Chloropyll
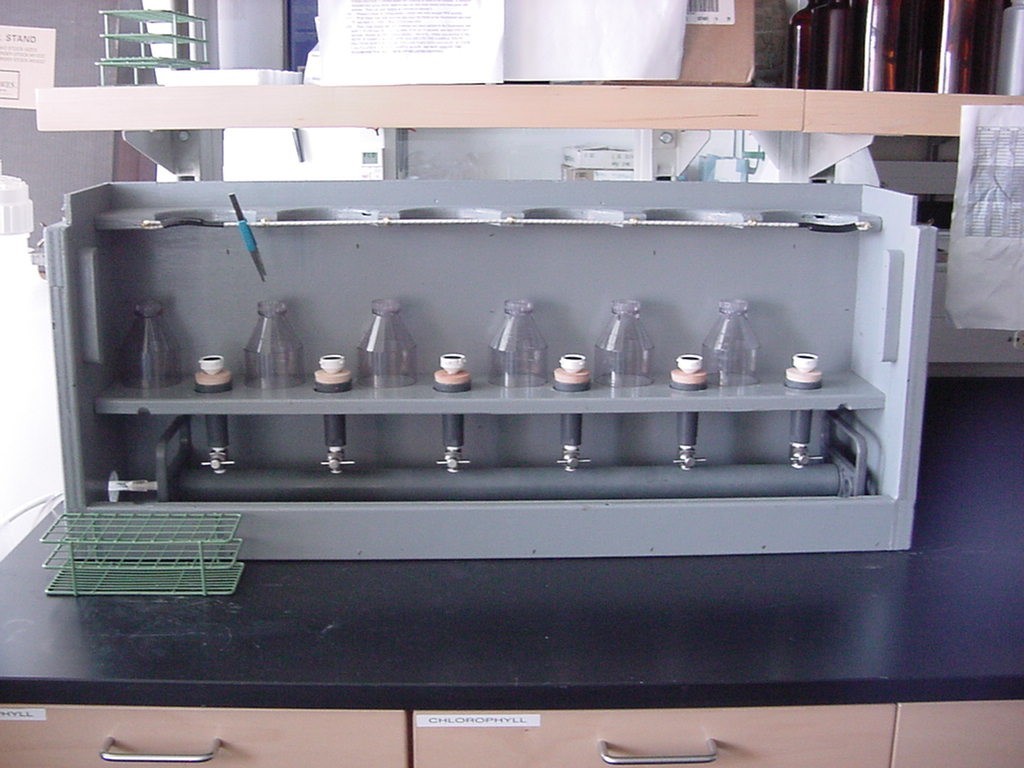
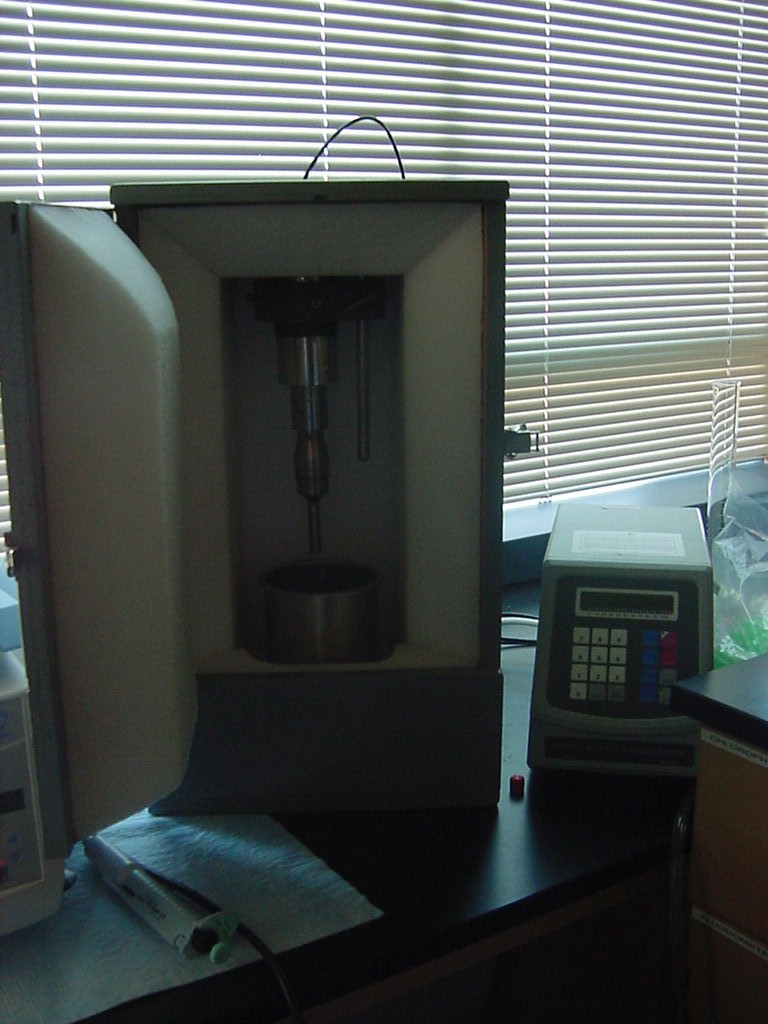
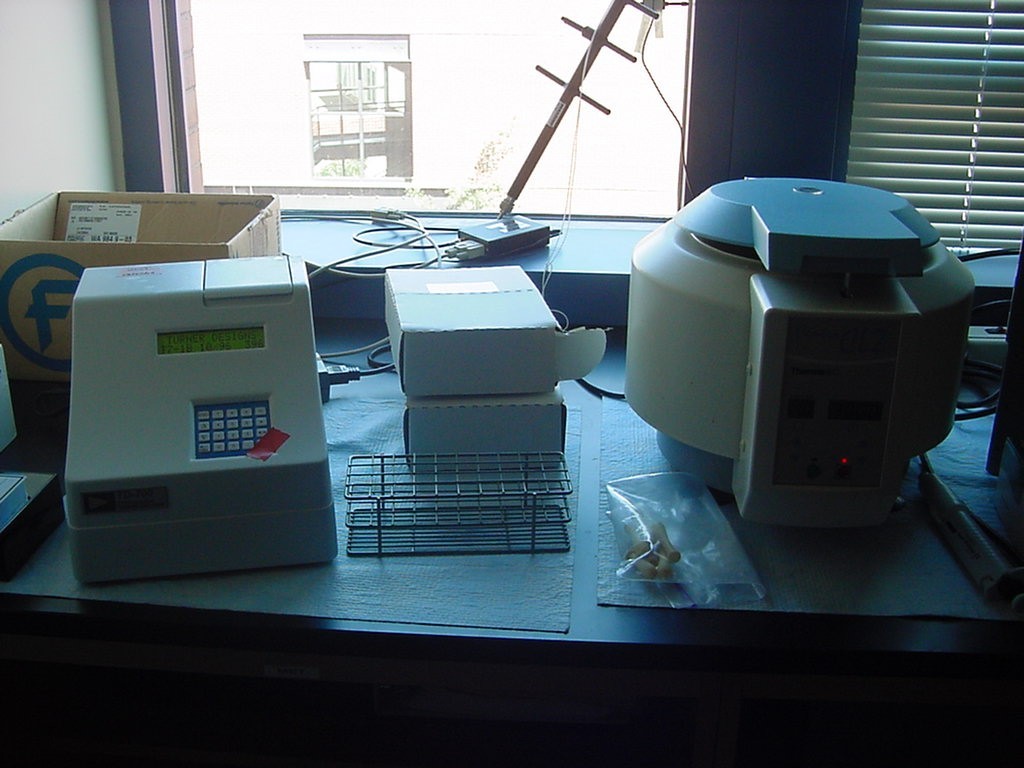
- Chlorophyll samples were treated in the lab by filtering the water thoroughly under suction and collecting the chlorophyll that remained in the glass filter papers. The filter paper was placed in 10ml of acetone and sonicated to burst the cells and release the chlorophyll into acetone. After sonication, the samples were placed into a centerfuge and spun down for 5 minutes at 3700rpms. The water at the top was extracted with a pipette and placed inside the fluorometer which measured for chlorophyll in mg/m3. (Strickland and Parsons, 1972)
Nutrient Sampling

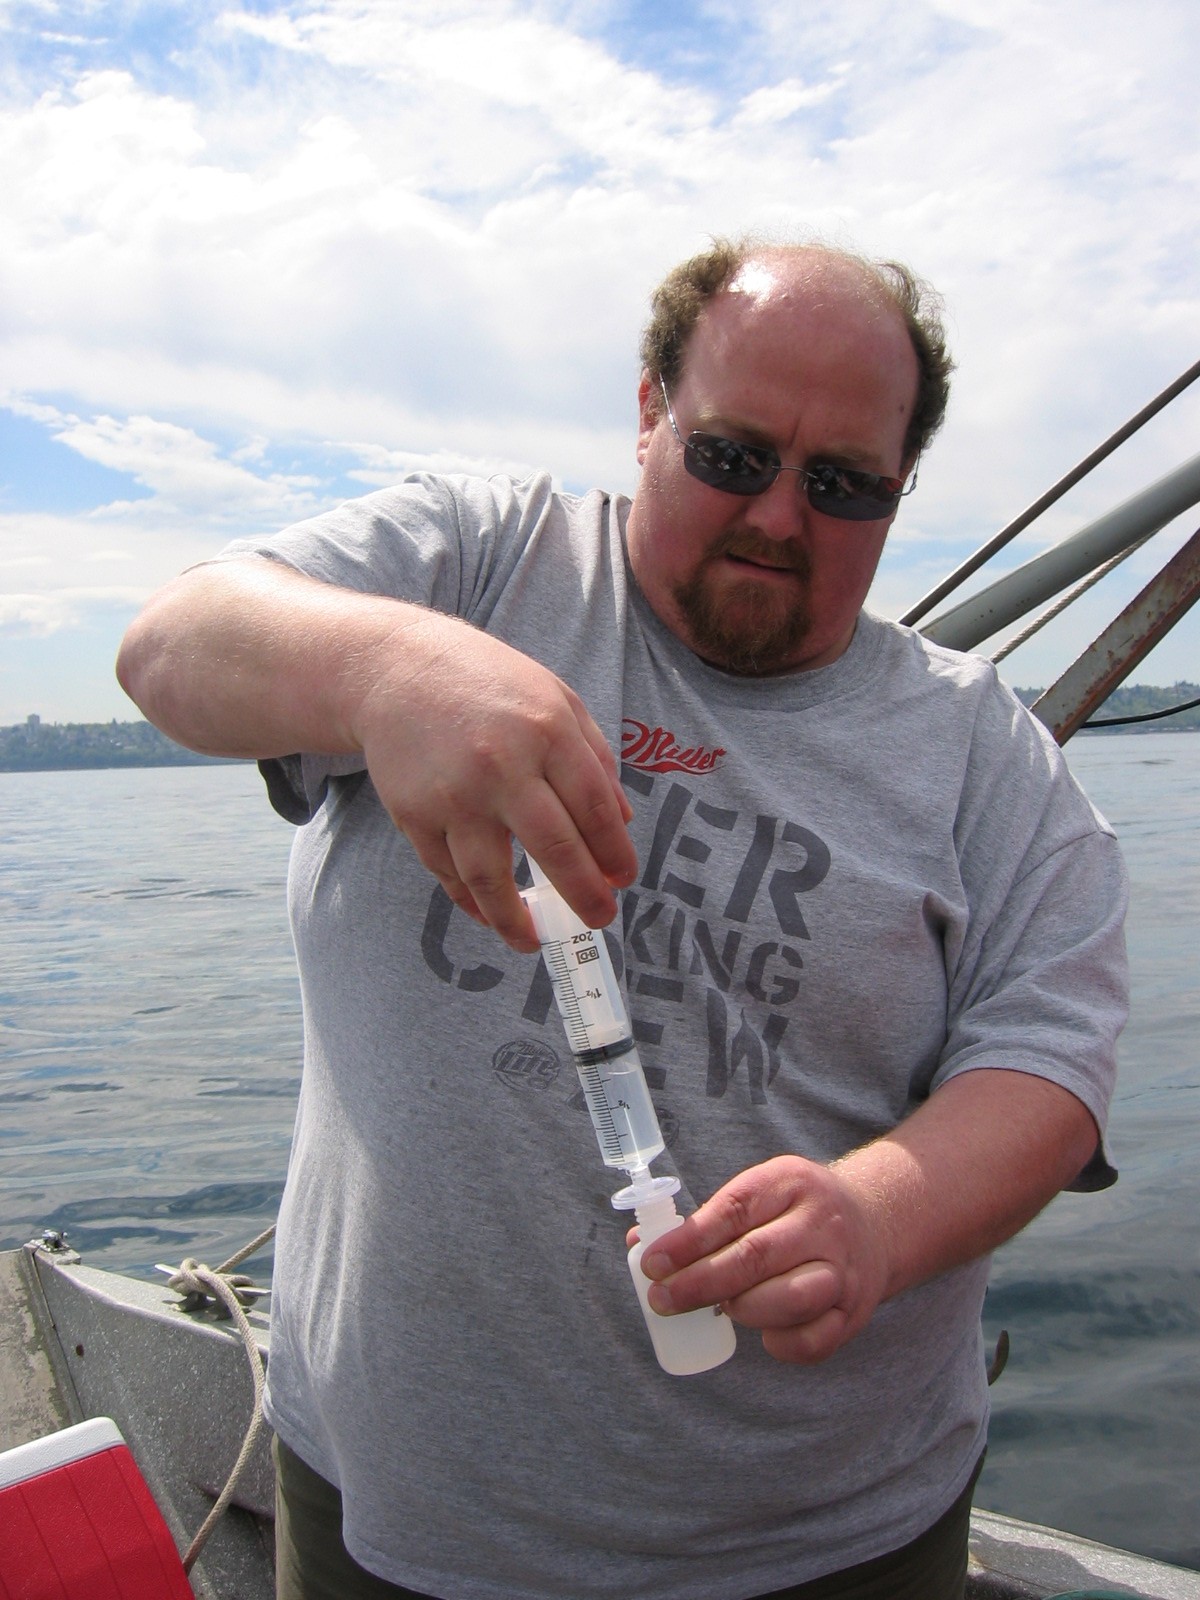
- Nutrient samples were collected from Niskin bottles and sent to the University of Washington Marine Chemistry Lab to be analyzed.
Secchi Disk
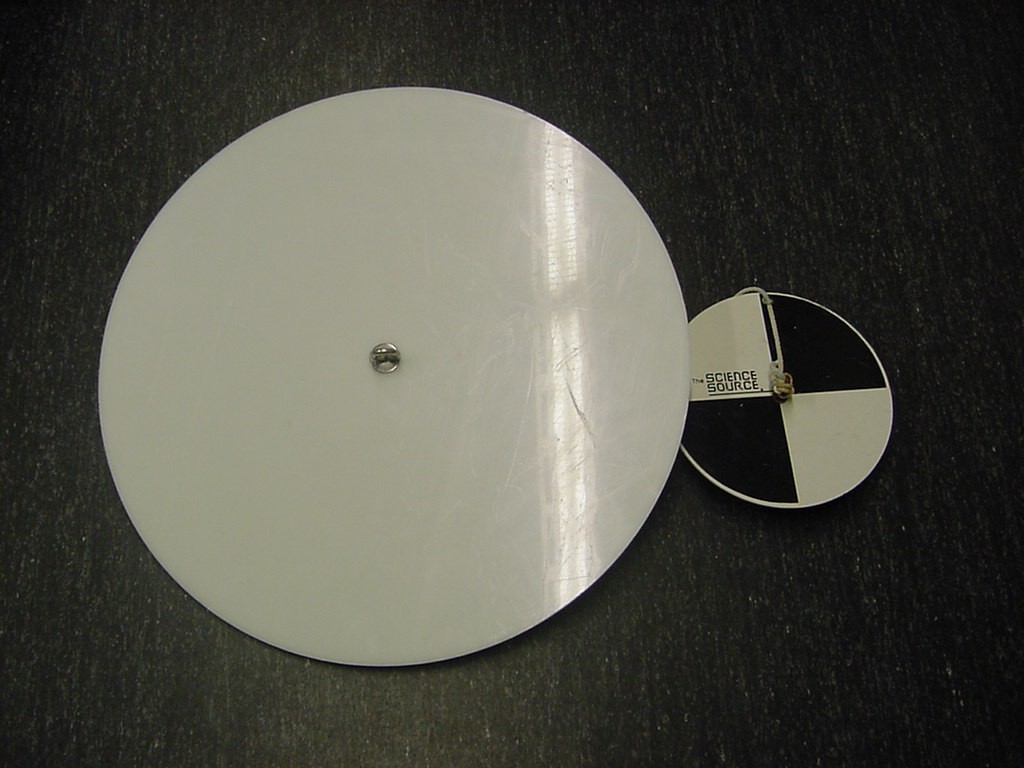


- Secchi disks of two sizes were used, the lake Secchi disk, which we typically used, is an 8-inch (20 cm) disk with alternating black and white quadrants; the ocean Secchi disk is 16 to 20 inches (40 or 50 cm) in diameter and it is solid white. The disks were lowered into the water off the side of the boat in consistent light. When the disk was no longer visible to the human eye, the depth was recorded. This depth of disappearance, called the Secchi depth, is a measure of the transparency of the water. Transparency can be affected by the color of the water, algae, and suspended sediments.
Licor
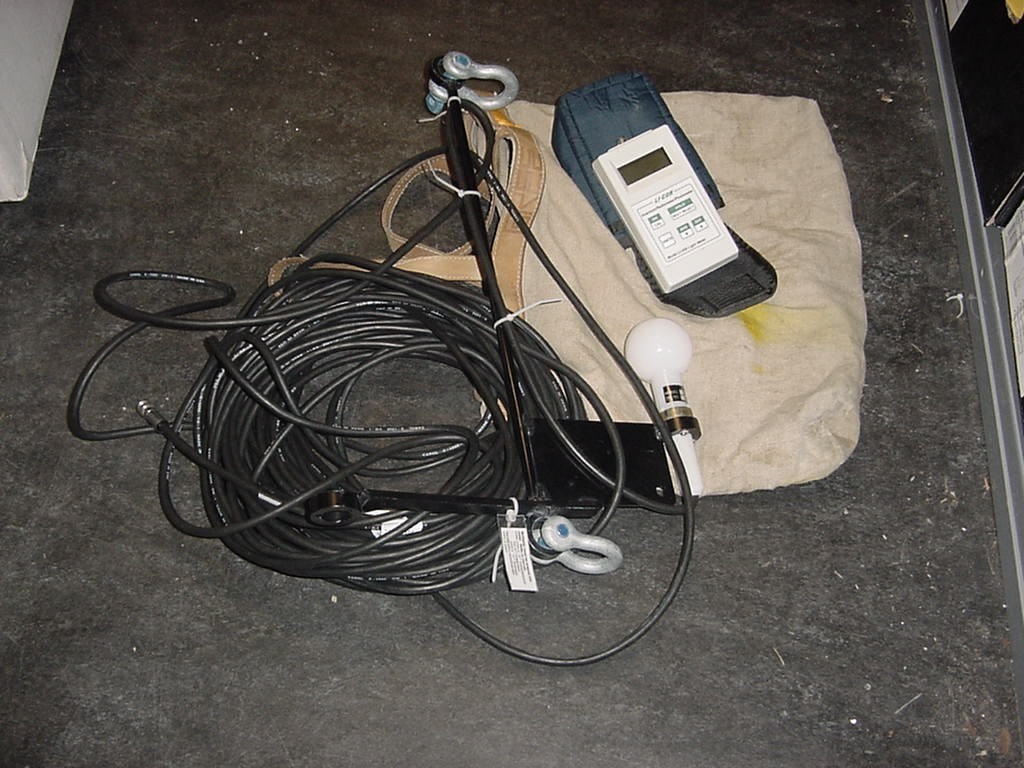
- LICOR is the company that manufactures the light meter. The light meter measures light transmission in Ámols of photons. As light radiation (from the sun) passes through the water column it is absorbed by primary producers, backscattered, and turned into heat. As light transmission decreases with depth, there is less energy for photosynthetic organisms. Using the light meter, we can find the 99% absorbance level, where plankton can no longer survive off sunlight alone. To find the 1% we use the formula: Iz = Ioe-z Where "z" is depth in meters, "n" is negative extinction coefficient, Io is light intensity at surface, and Iz is solar irradiance. (Wetzel, 2001) Using our exponential trendline equations after plotting our data in Excel, we found where the theoretical 1% transmission depth would be.
Surface Plankton Net
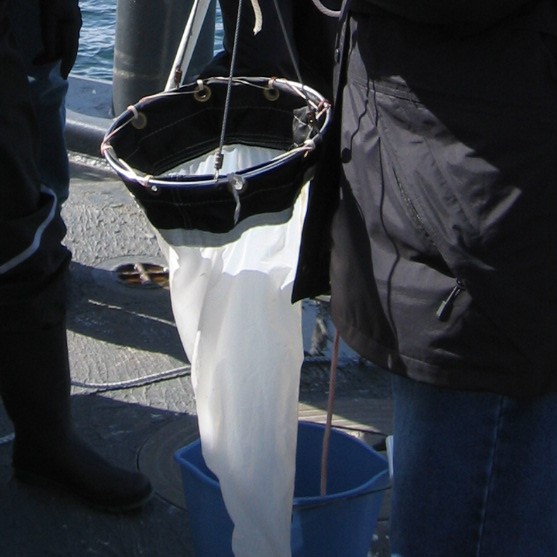
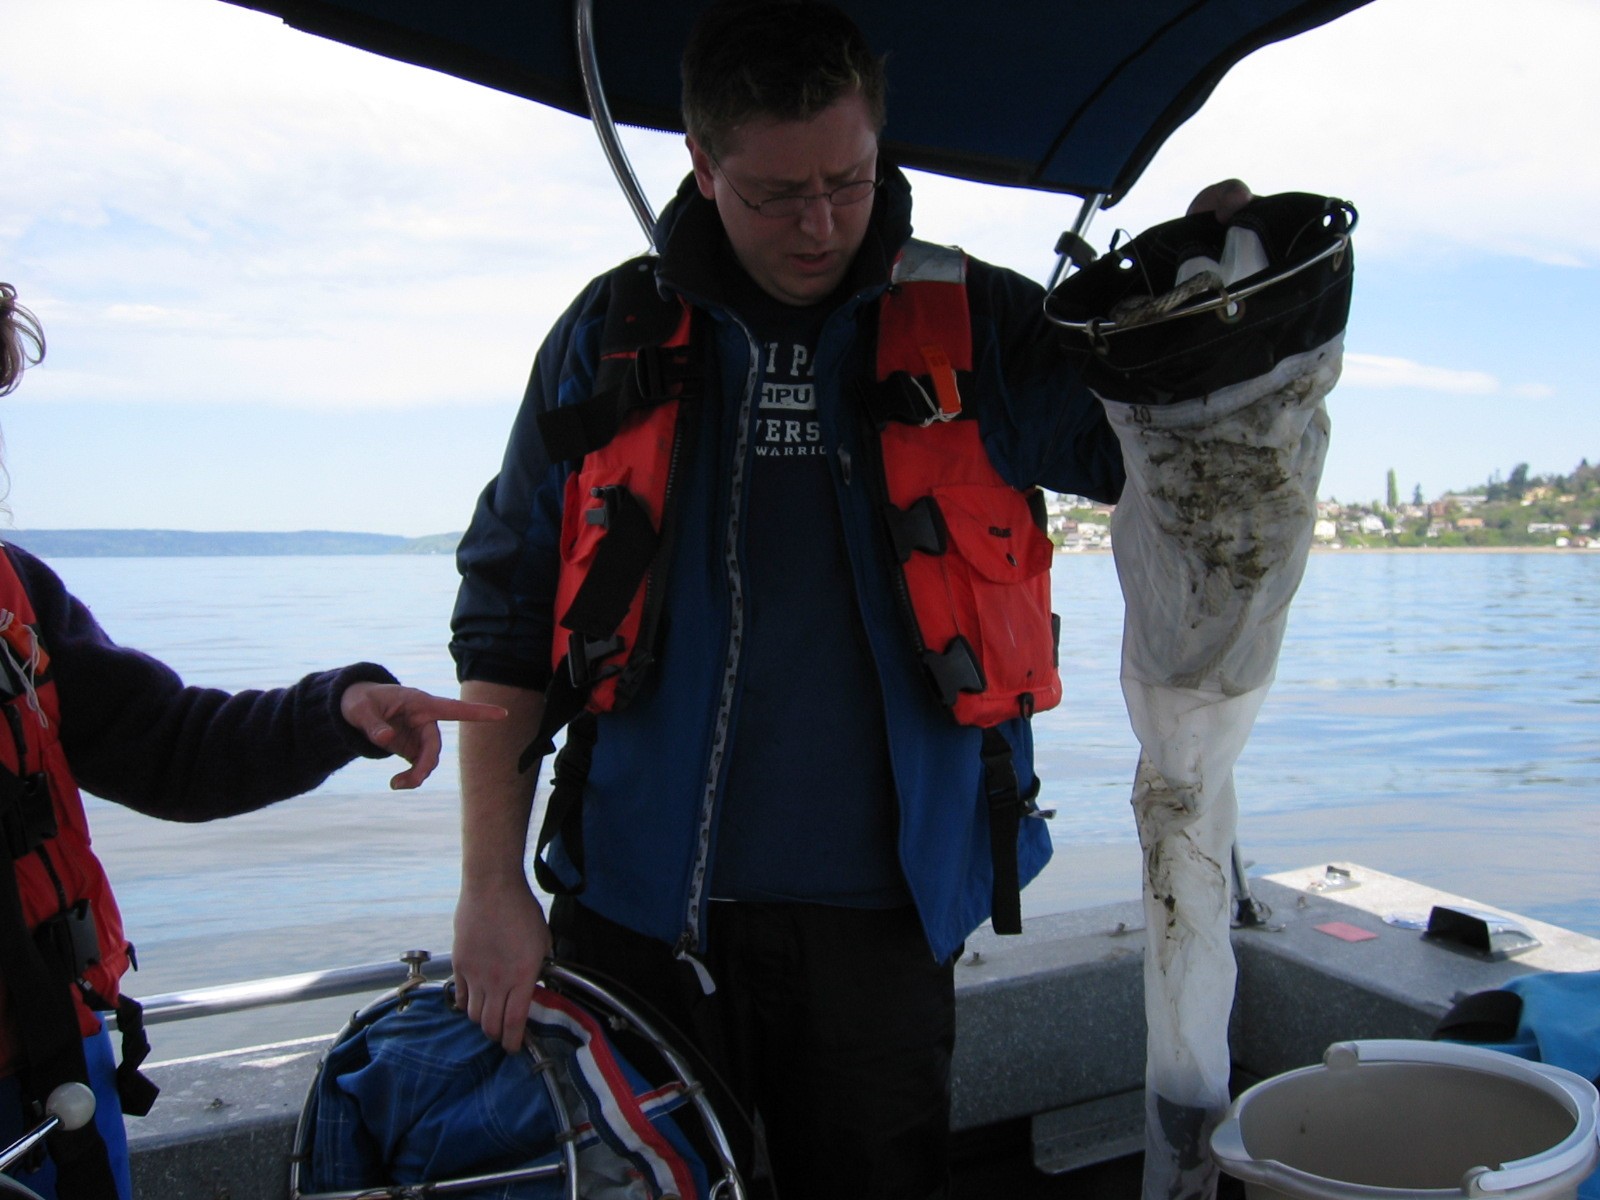
- A 20 micron mesh net was used to collect phytoplankton. The net was lowered approximately 2-3 meters and pulled through the water to gather plankton. The samples were then rinsed into containment jars for later analysis.
Puget Sound Closing Plankton Net
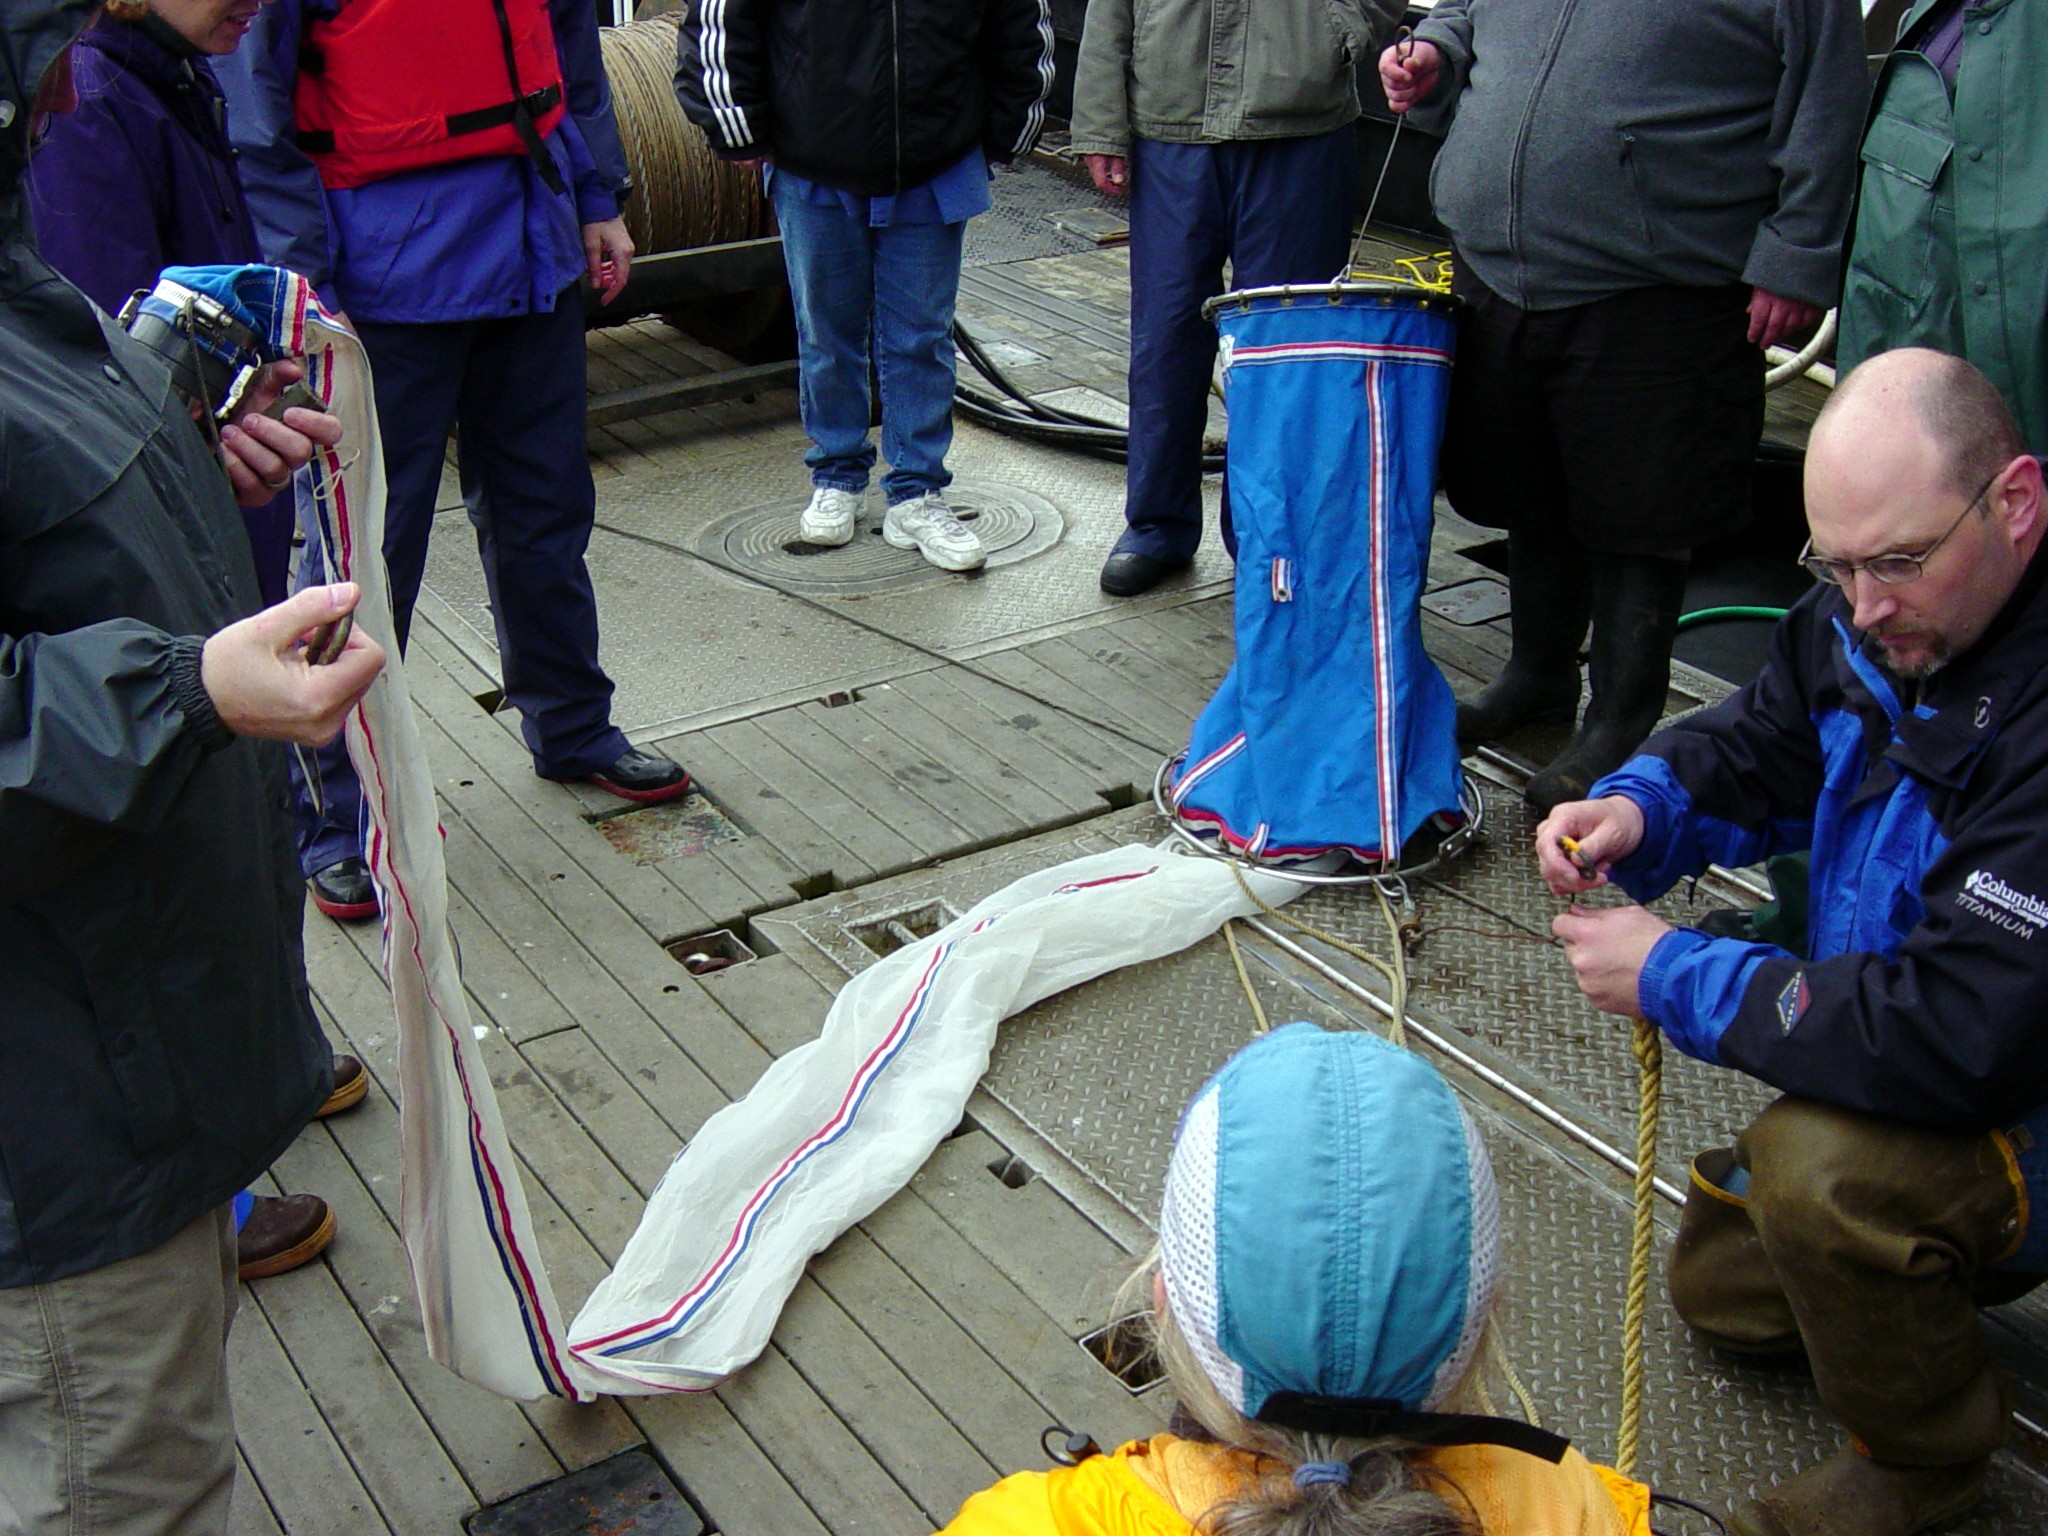
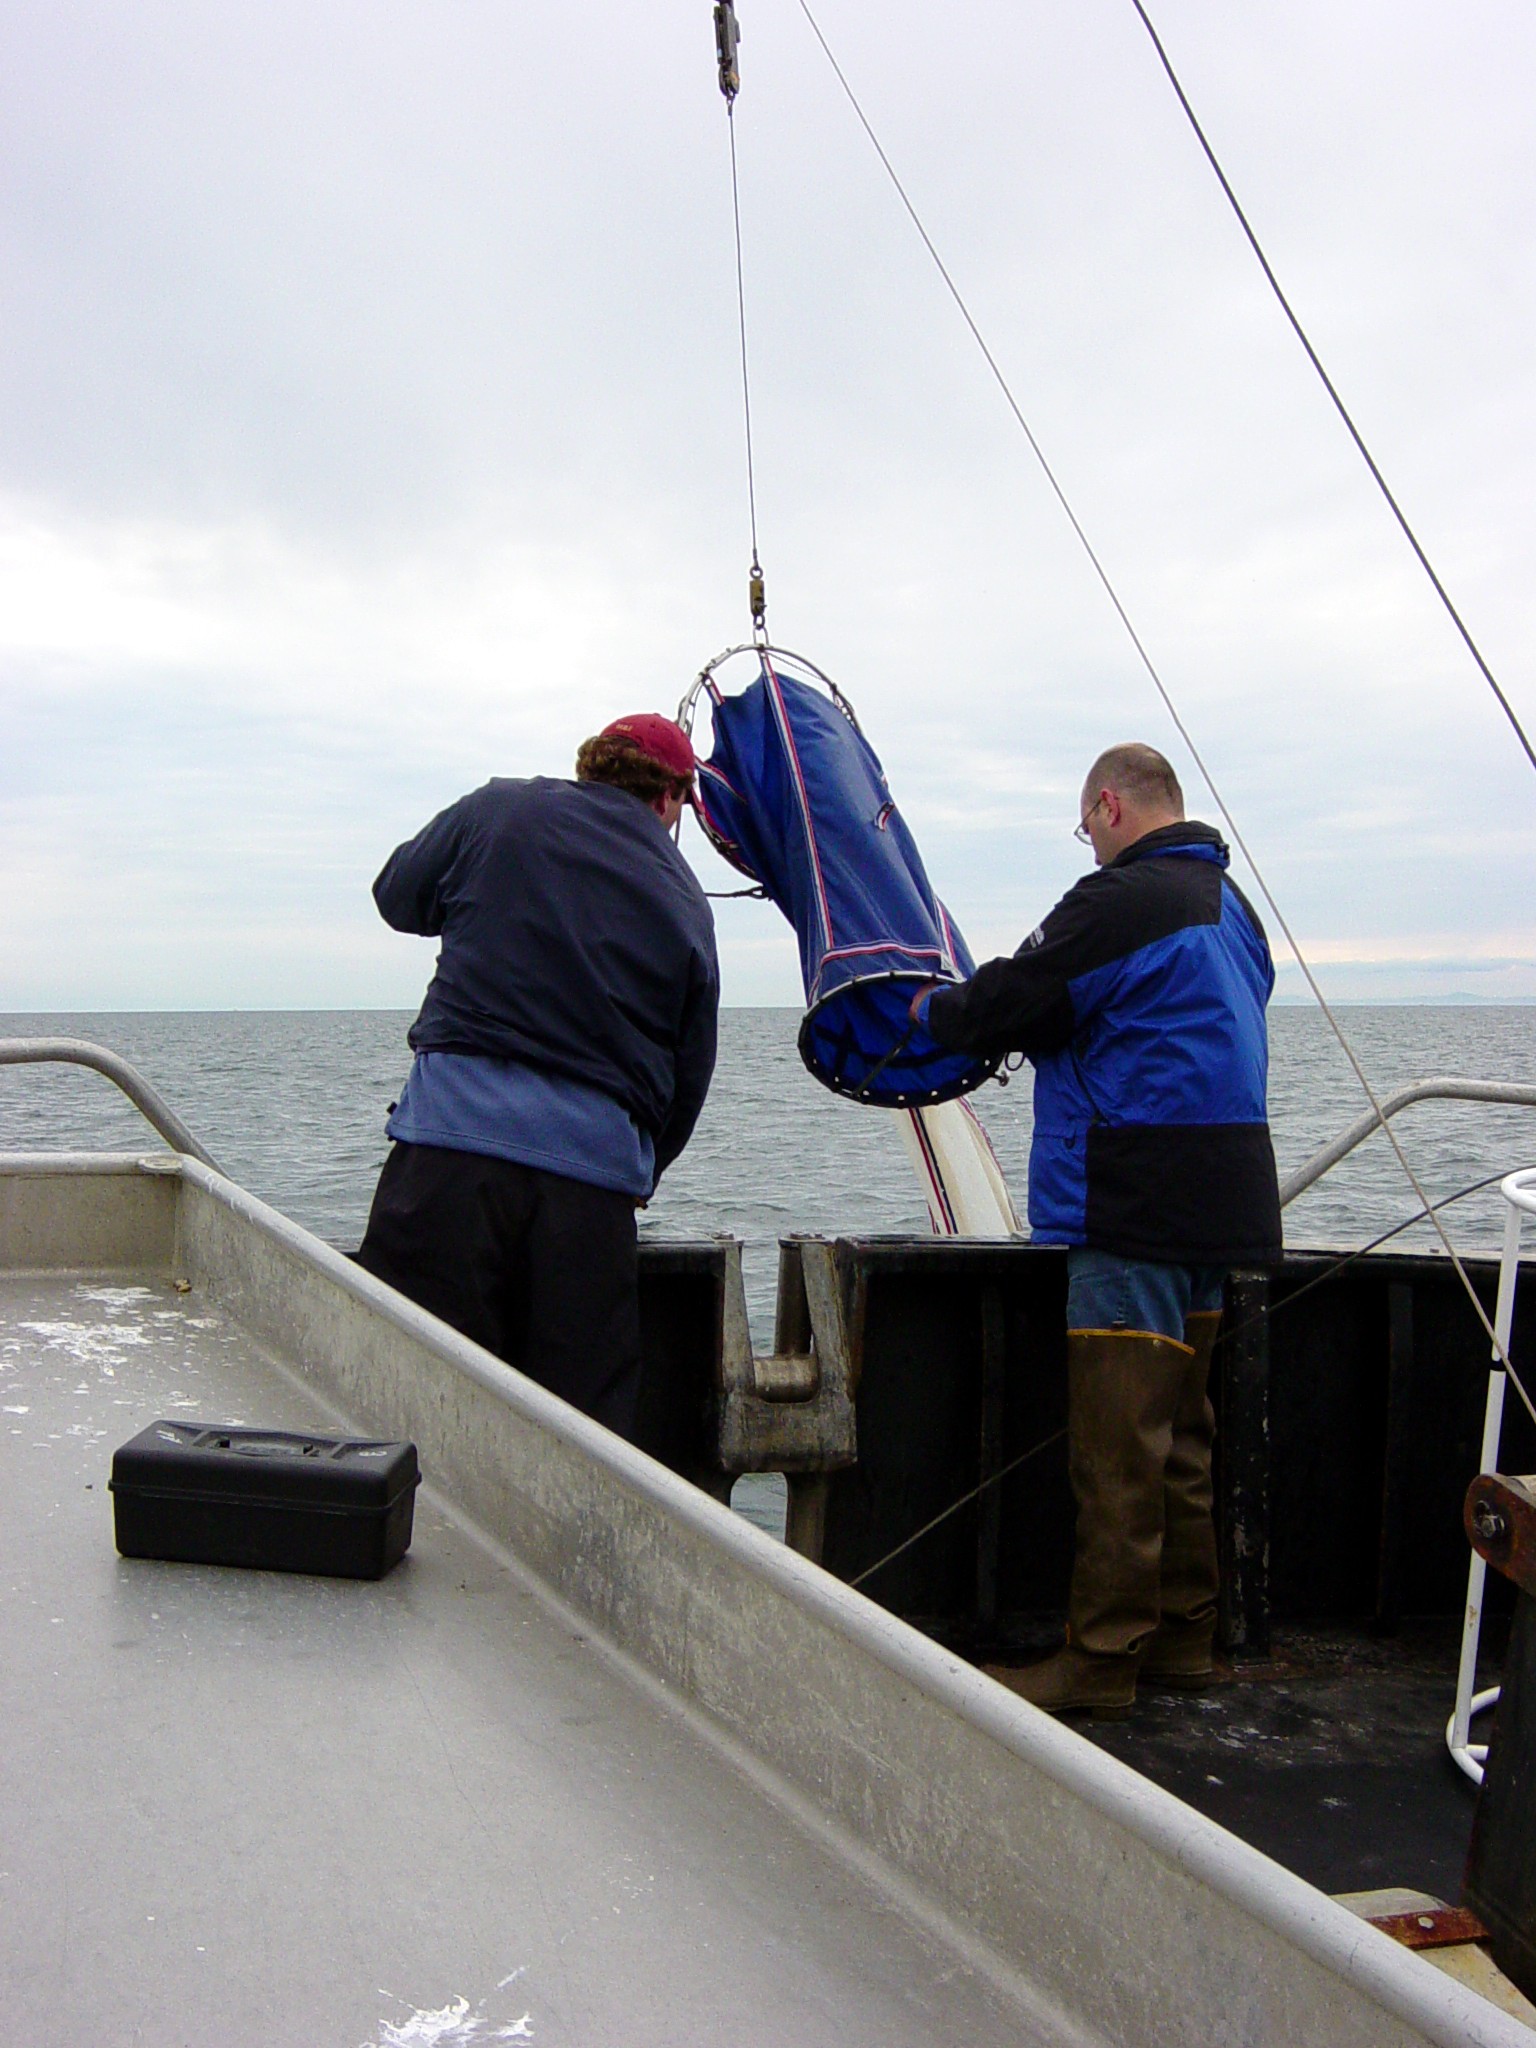

- The Closing net was used to take deep zooplankton samples. The net was attached to a line and lowered into the water. At the desired depth, a messenger was sent down to close the net. The net was then hauled back to the surface and the water was filtered through the PVC collecting bucket. The bucket is rinsed with filtered seawater and poured into a containment jar.
Plankton Counts

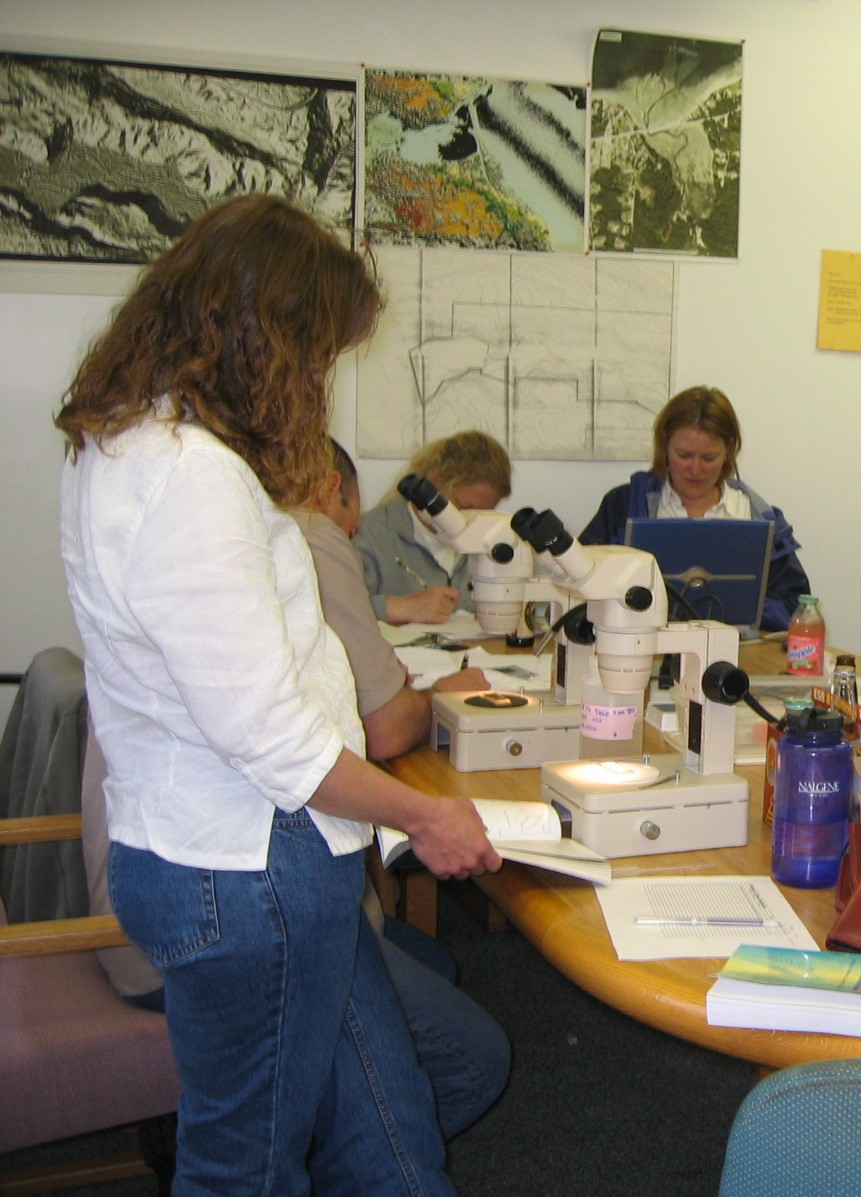

- Both phytoplankton and zooplankton samples were taken from various locations on each of our sampling days. Zooplankton samples were counted using counting microscopes and each sample was placed on a Sedgwick/Rafter Counting Cell, which holds 1ml per cell. To count phytoplankton we first fixed the solutions with 37% formalin at 1ml per 100ml. After being fixed, the samples were placed onto Palmer Counting Cells, which each hold .1ml of fluid, and each type of phytoplankton seen was recorded and counted. After being counted, the numbers were plugged into an equation to find the total number of phytoplankton in the sample per ml. For example, if Station #1 from a sampling site had a total of 745 phytoplankton, that number is then divided by .1ml and multiplied by the total ml of the jar, say 57. The answer, 42,465, is then divided by 2500ml, to give 16.986 phytoplankton per ml of water. The numbers are recorded and graphed by stations for comparisons.
Van Veen Grab
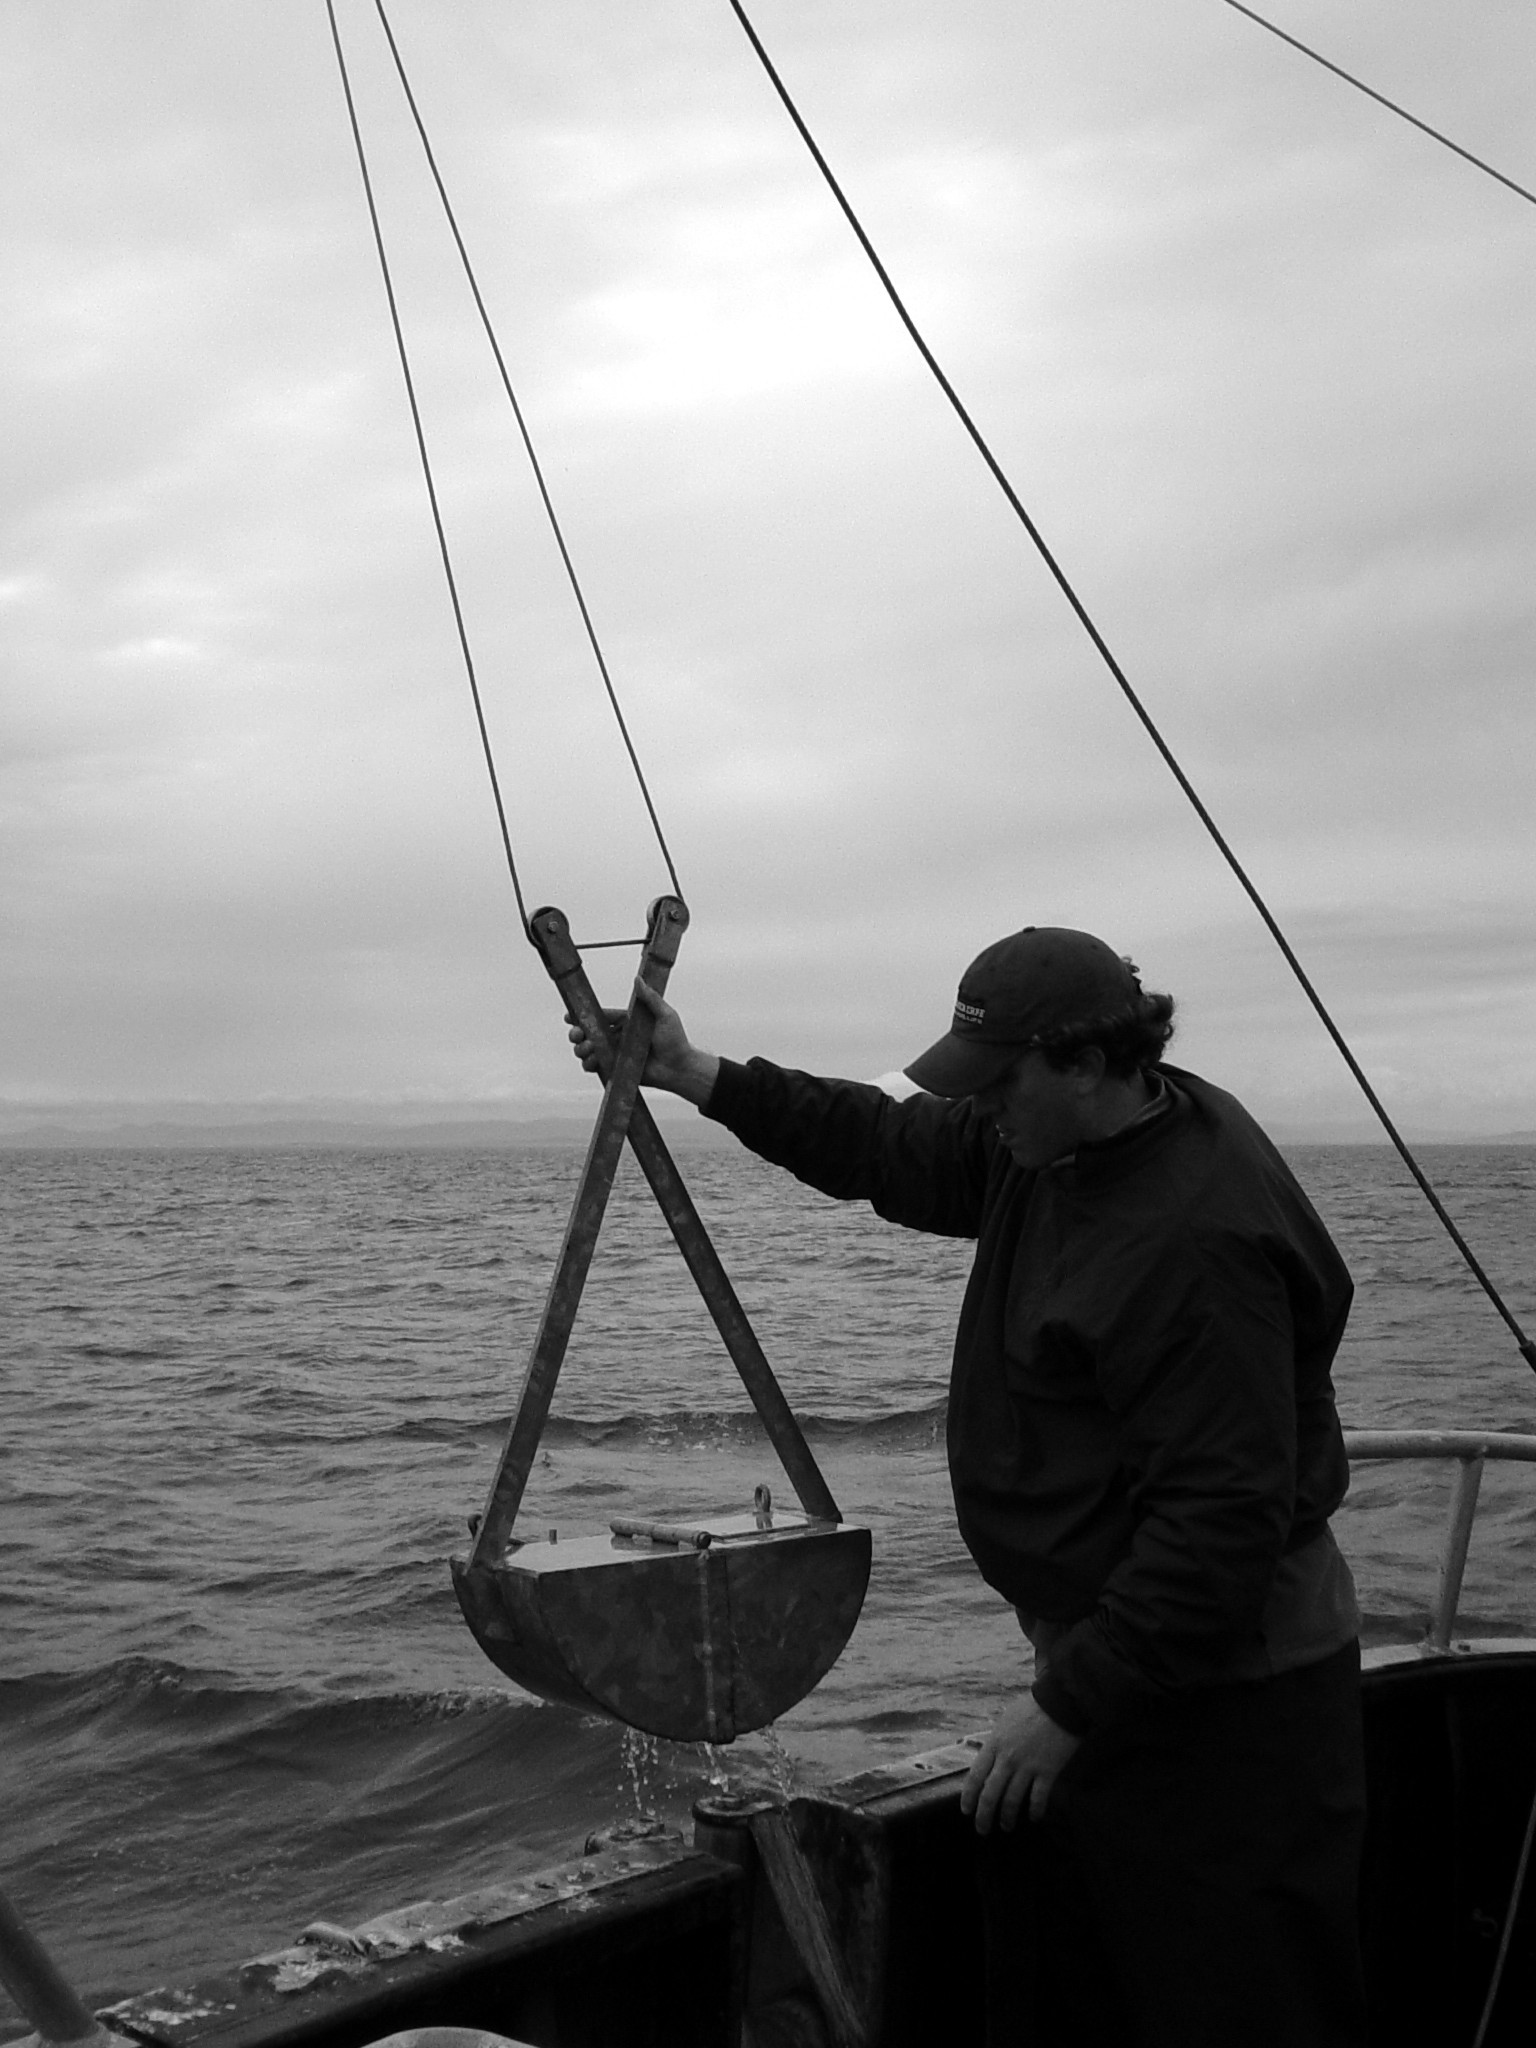
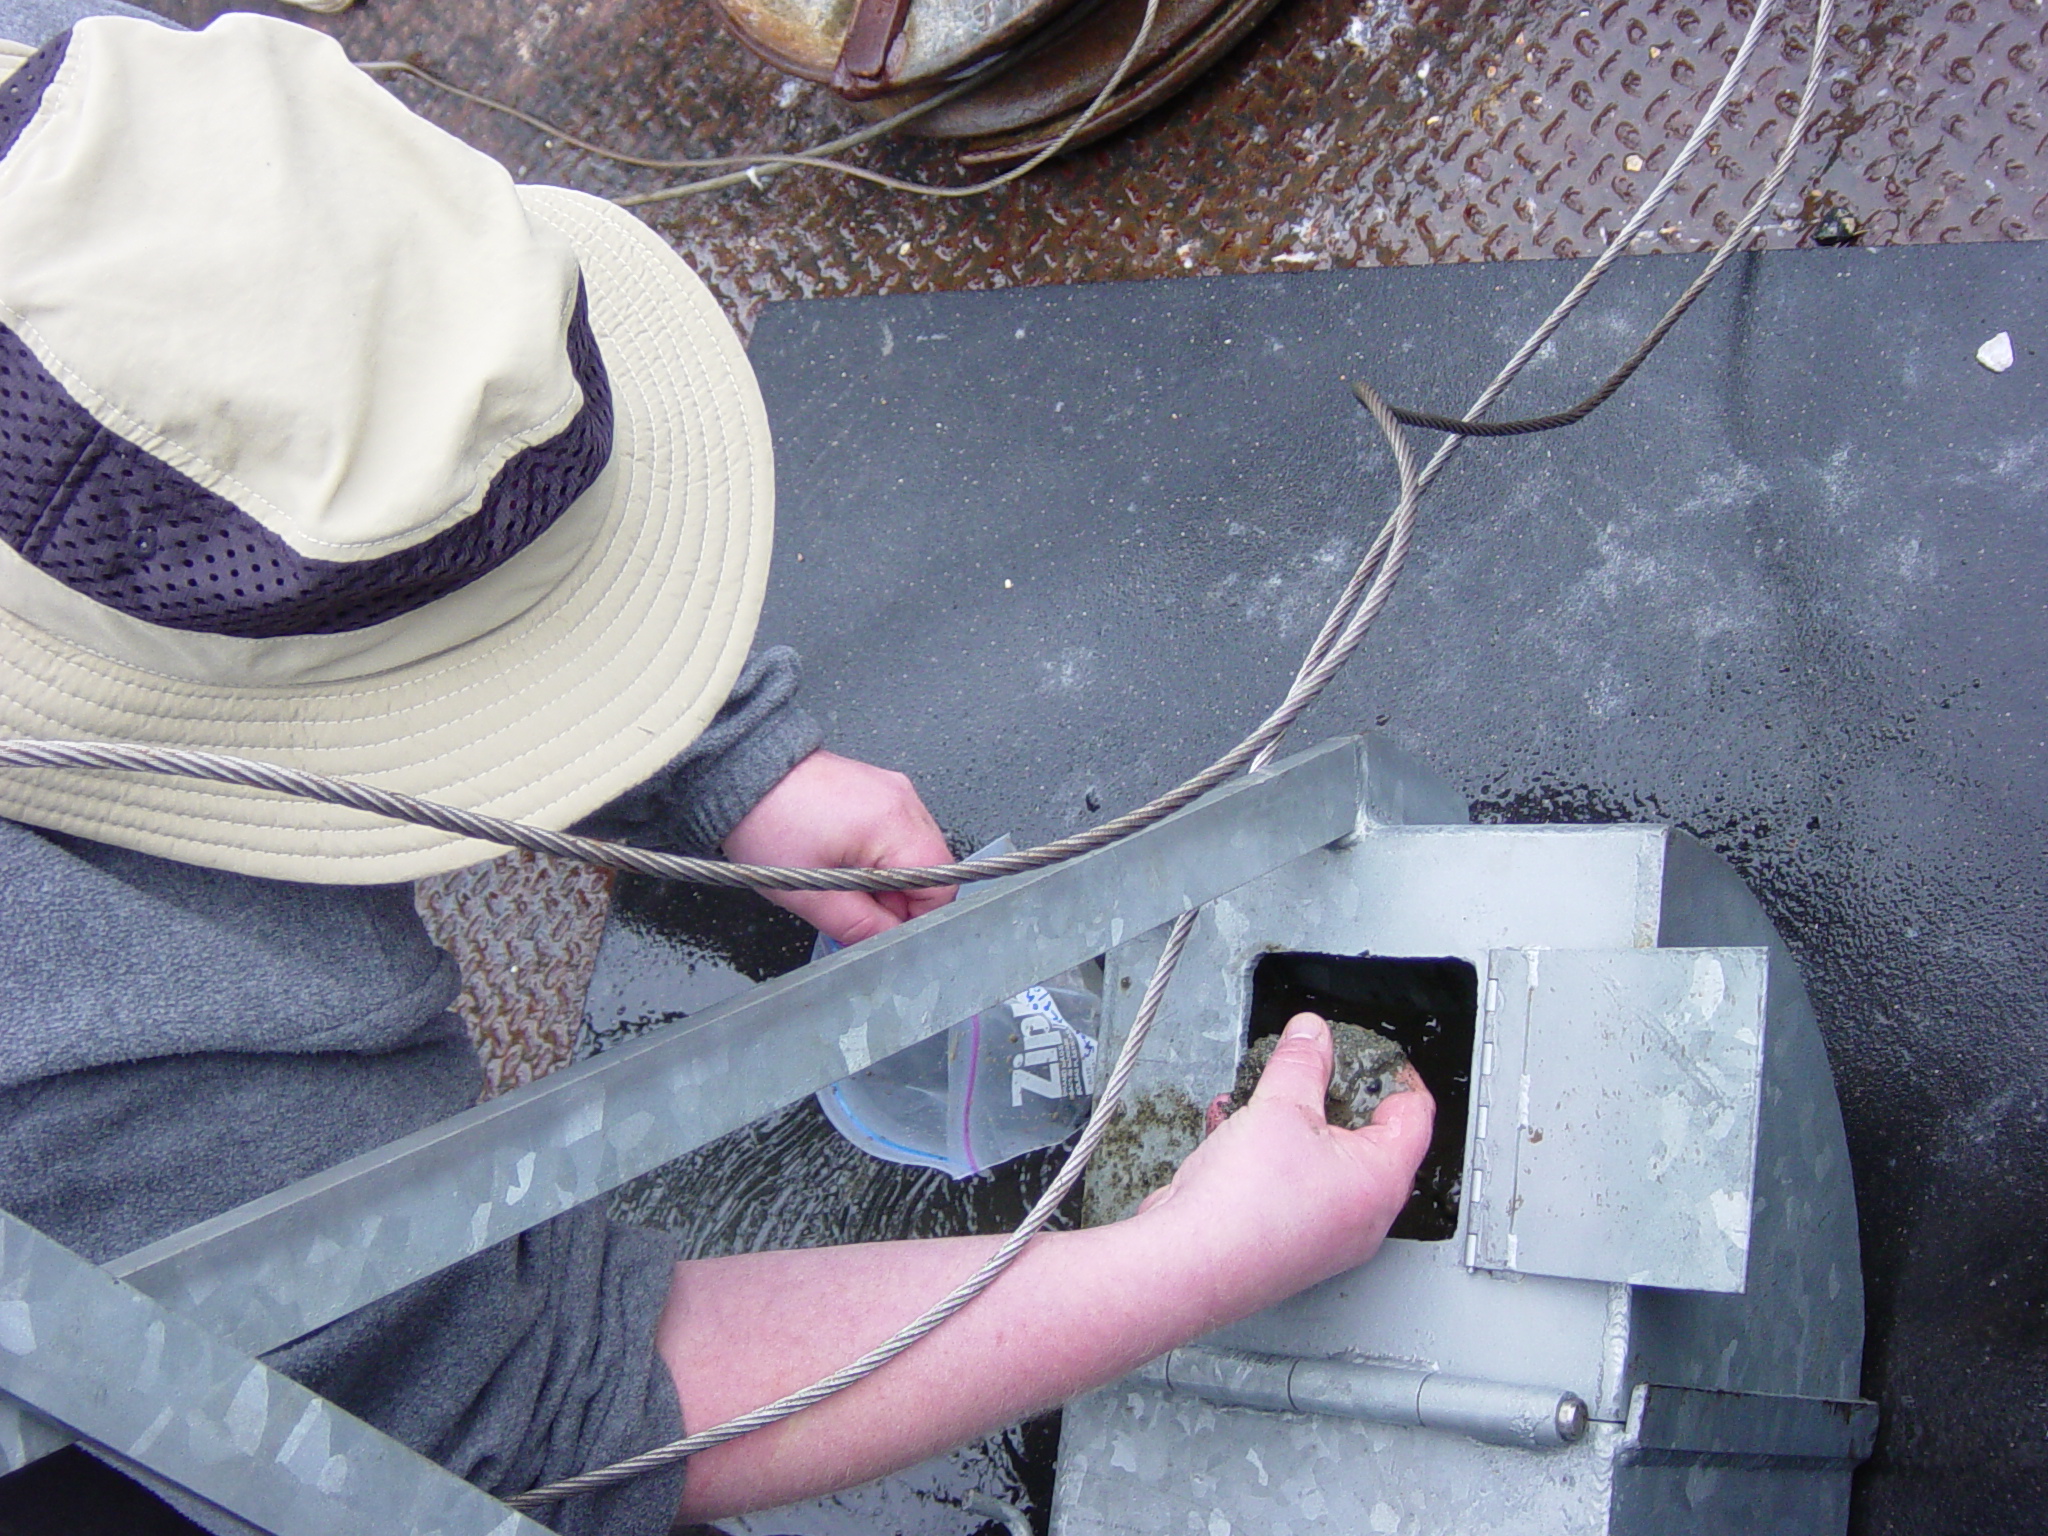
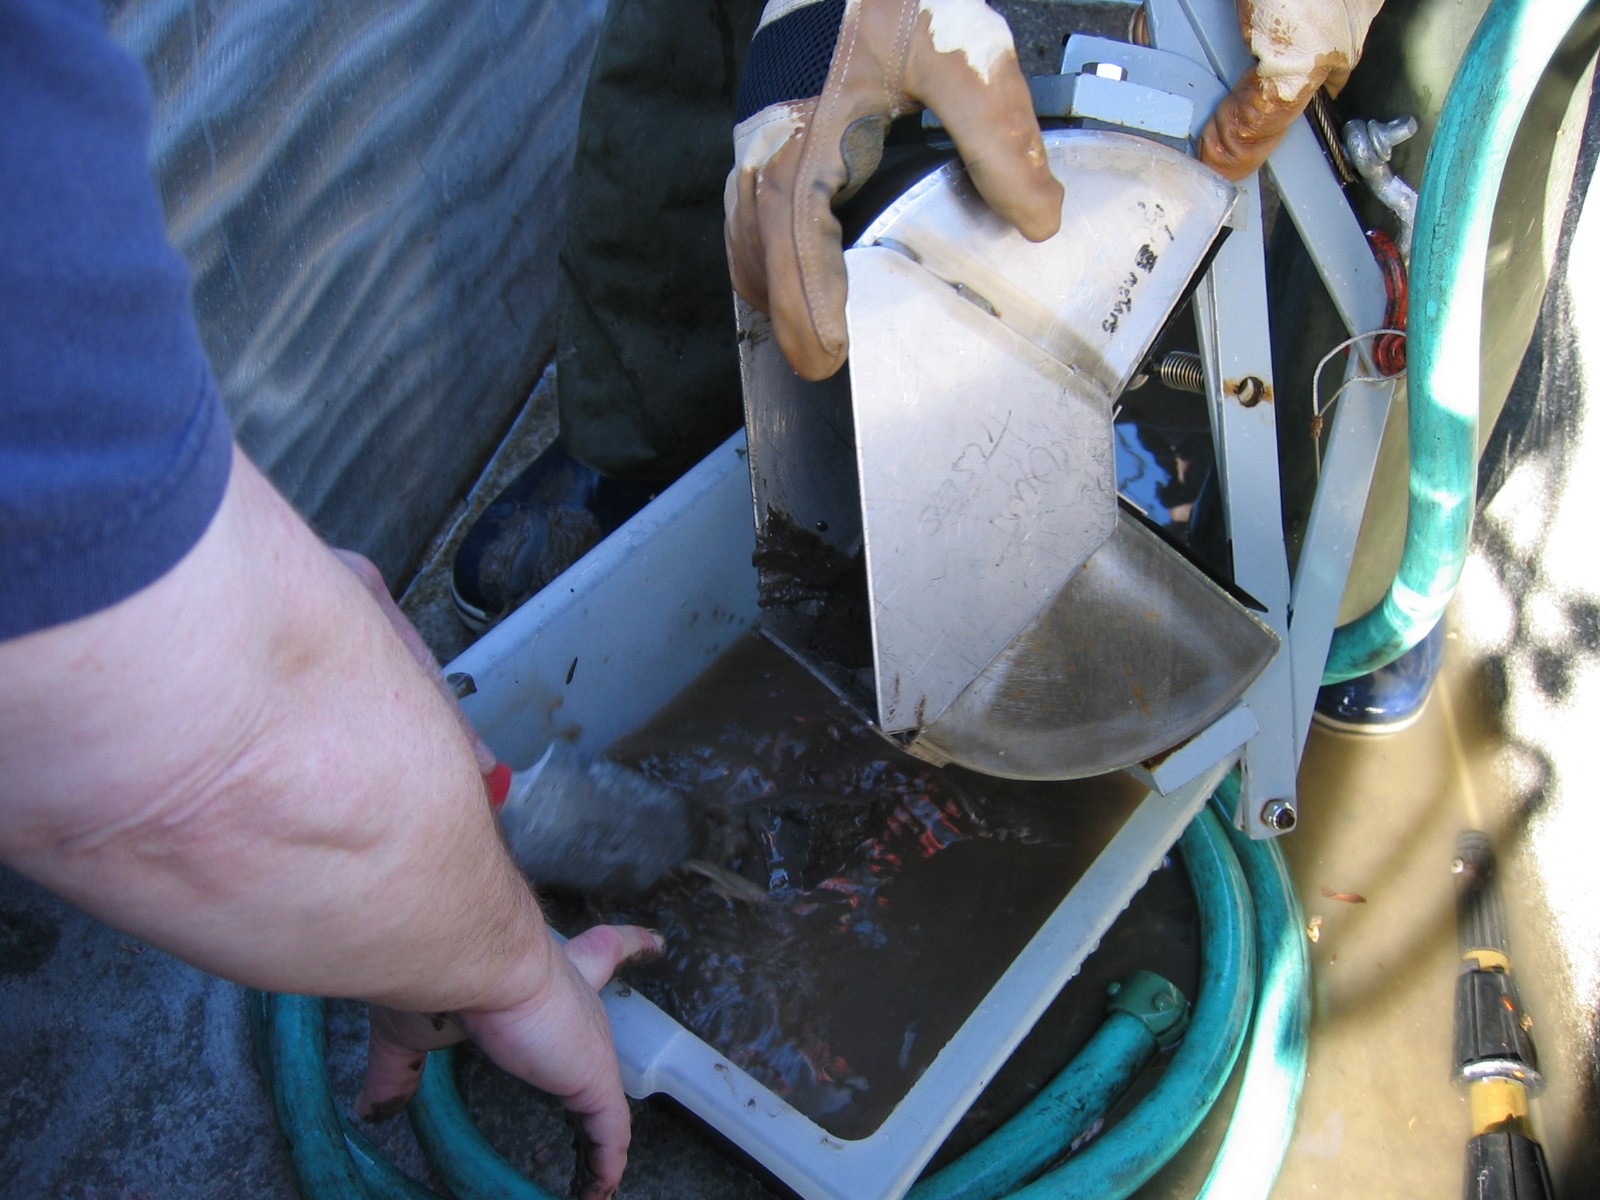
- The Van Veen Grab was used to retrieve sediment samples from the ocean floor. It was attached to a wire and lowered until it hit the bottom. As the lowering wire slackens, the hook on the release device rotates and the short suspension chains fall free. When the retrieved wire is slowly made taut, chains (attached at the top of the release) exert considerable force on the long lever-arms, extending beyond the jaws, causing them to slowly lift. Upward movement of the arms, which are welded externally to the jaws, causes the jaws to dig deeper into the sediment and trap a substantial mass of material as they pivot tightly closed. The arms are extra-thick, to withstand jerking in heavy seas. The samples were bagged and kept on ice for later analysis.
Grain Size Analysis Sieve

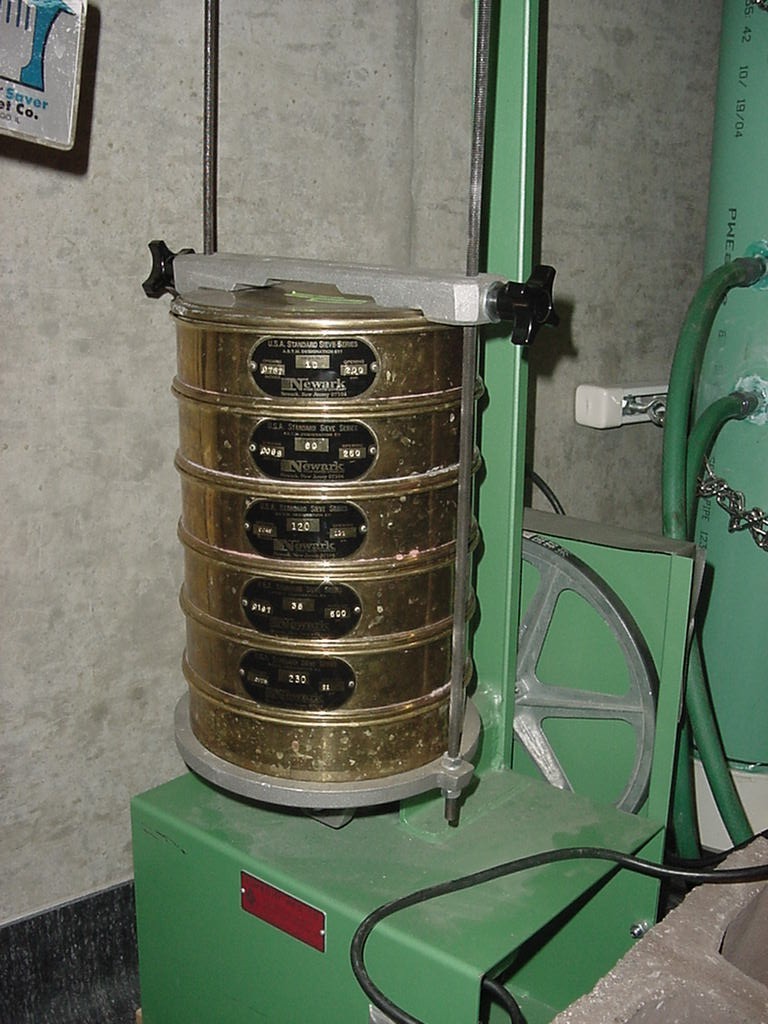
- To use the sieve method, first the sample is dried in an oven at 60░ C. When the sample is dried out, it is weighed and recorded. The sample is then placed in the tiered sieve and shaken for 30 minutes. As it is shaken, the sediment falls through the mesh in each layer of the sieve until it is too large to pass. Each layer is measured by weight and recorded for graphing.
Grain Size Analysis PSA
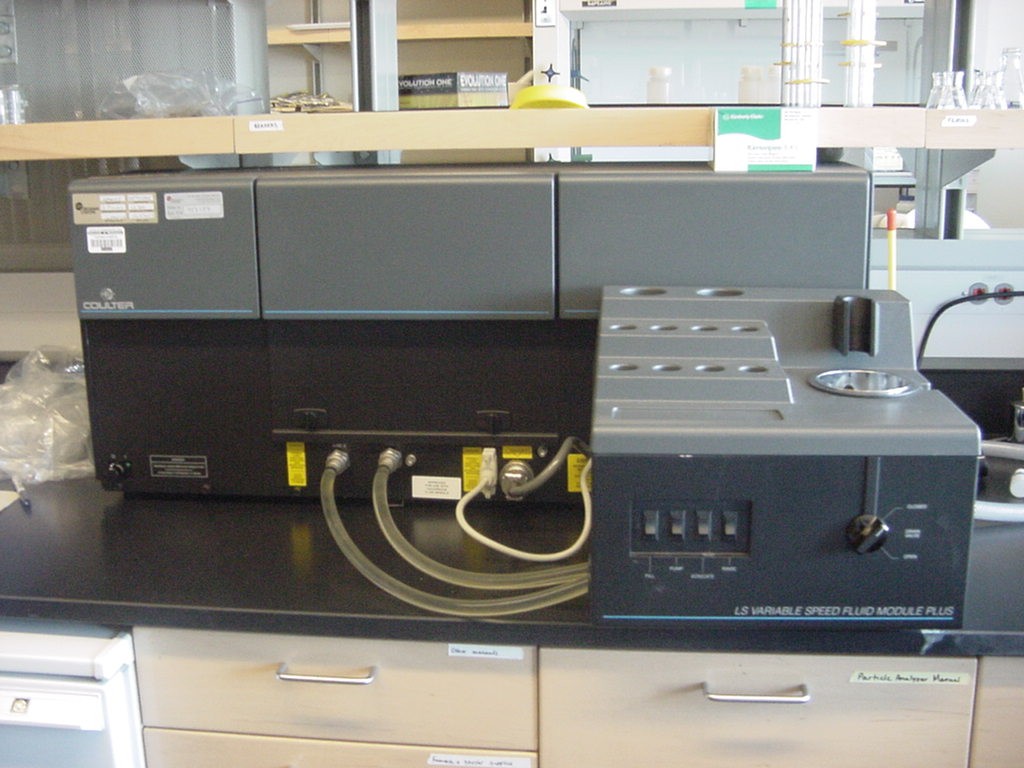

- The Coulter LS 200 Particle Size Analyzer (PSA) calculates sediment samples by volume. The PSA uses a laser to find grain-size. As the beam shines from one side to the other, water containing the added sediment sample is passed through the beam, and a receptacle on the other end measures how much the light was diffracted to determine the size of the added sediment
References
- Carpenter, J.H. 1965a. The accuracy of the Winkler method for dissolved oxygen. Limnology and Oceanography 10: 135-140.
- Strickland, J.D.H.; Parsons, T.R. 1972. A Practical Handbook of Seawater Analysis. The Alger Press Ltd. Ottowa.
- Wetzel, R. 2001. Limnology: Lake and River Ecosystems 3rd ed. Academic Press, San
Diego.
| TESC 431 Home | Methods | Researchers | Bloopers |
Created by: Jeff Smith and Viki Aldridge


