| TESC 431 Home | QMH Intro | Methods | Results | Plankton | Sediments |
| |
| |
| |
In this study we conducted water profiles at Quartermaster Harbor on May 6, 2005. A water profile was collected at all five locations using a CTD that recorded pressure, temperature, conductivity, dissolved oxygen, fluorescence, and percent transmission. Readings were collected 2 times per second, while the downcast was processed for analysis. A second water profile was collected at stations 1 and 3 using a Hydrolab® probe that read temperature, conductivity, dissolved oxygen, and pH. Secchi depth was measured using both a 20 cm black and white disk, and a 59 cm white oceanographic disk.
Two water samples were collected from all stations at both the surface and a depth ~1 m above the deepest CTD point using 2.5-liter Niskin bottles. Dissolved oxygen samples were collected in 125 ml D.O. bottles and tested with a dosimat using the Carpenter (1965) modification of the Winkler Titration Method. Chlorophyll-a samples were collected in 125 ml Nalgene® bottles and filtered onto glass fiber filters with drops of MgCO3 and sonicated with 90% acetone for 7 minutes (Strickland and Parsons 1972). The samples were then centrifuged for 5 minutes at 3700 rpm. The supernatant was analyzed in a Turner Design TD-700 fluorometer. Nutrient samples were collected and filtered with 0.45 μm filters and frozen for later analysis.
A surface phytoplankton tow was conducted with a 70 μm net at station 5, and surface plankton samples were collected by filtering 2.5 liter Niskin bottles from the surface and counted. A deep vertical zooplankton tow was done at station 5 from 120-70 m depth with a closing net. Plankton density was calculated by averaging the plankton counts for each station, dividing by the slide volume, and multiplying by the concentrated sample size to determine the estimated number of plankton in the concentrated sample. The concentrated sample was divided by the volume of water used to obtain the concentrated sample to determine the density of plankton per mL or per m3.
A Licor® brand photometer was used to determine compensation depth by measuring light absorption at depths, and then using an exponential line equation to determine compensation depth.
Sediment samples were collected using a 6 x 6 inch Ponar grab sampler at station 1 and 3. Grain size analysis was conducted for percent weight by shaking with sieves for 30 minutes, and grain size analysis was conducted for percent volume using a Coulter LS 200 Particle Size Analyzer.
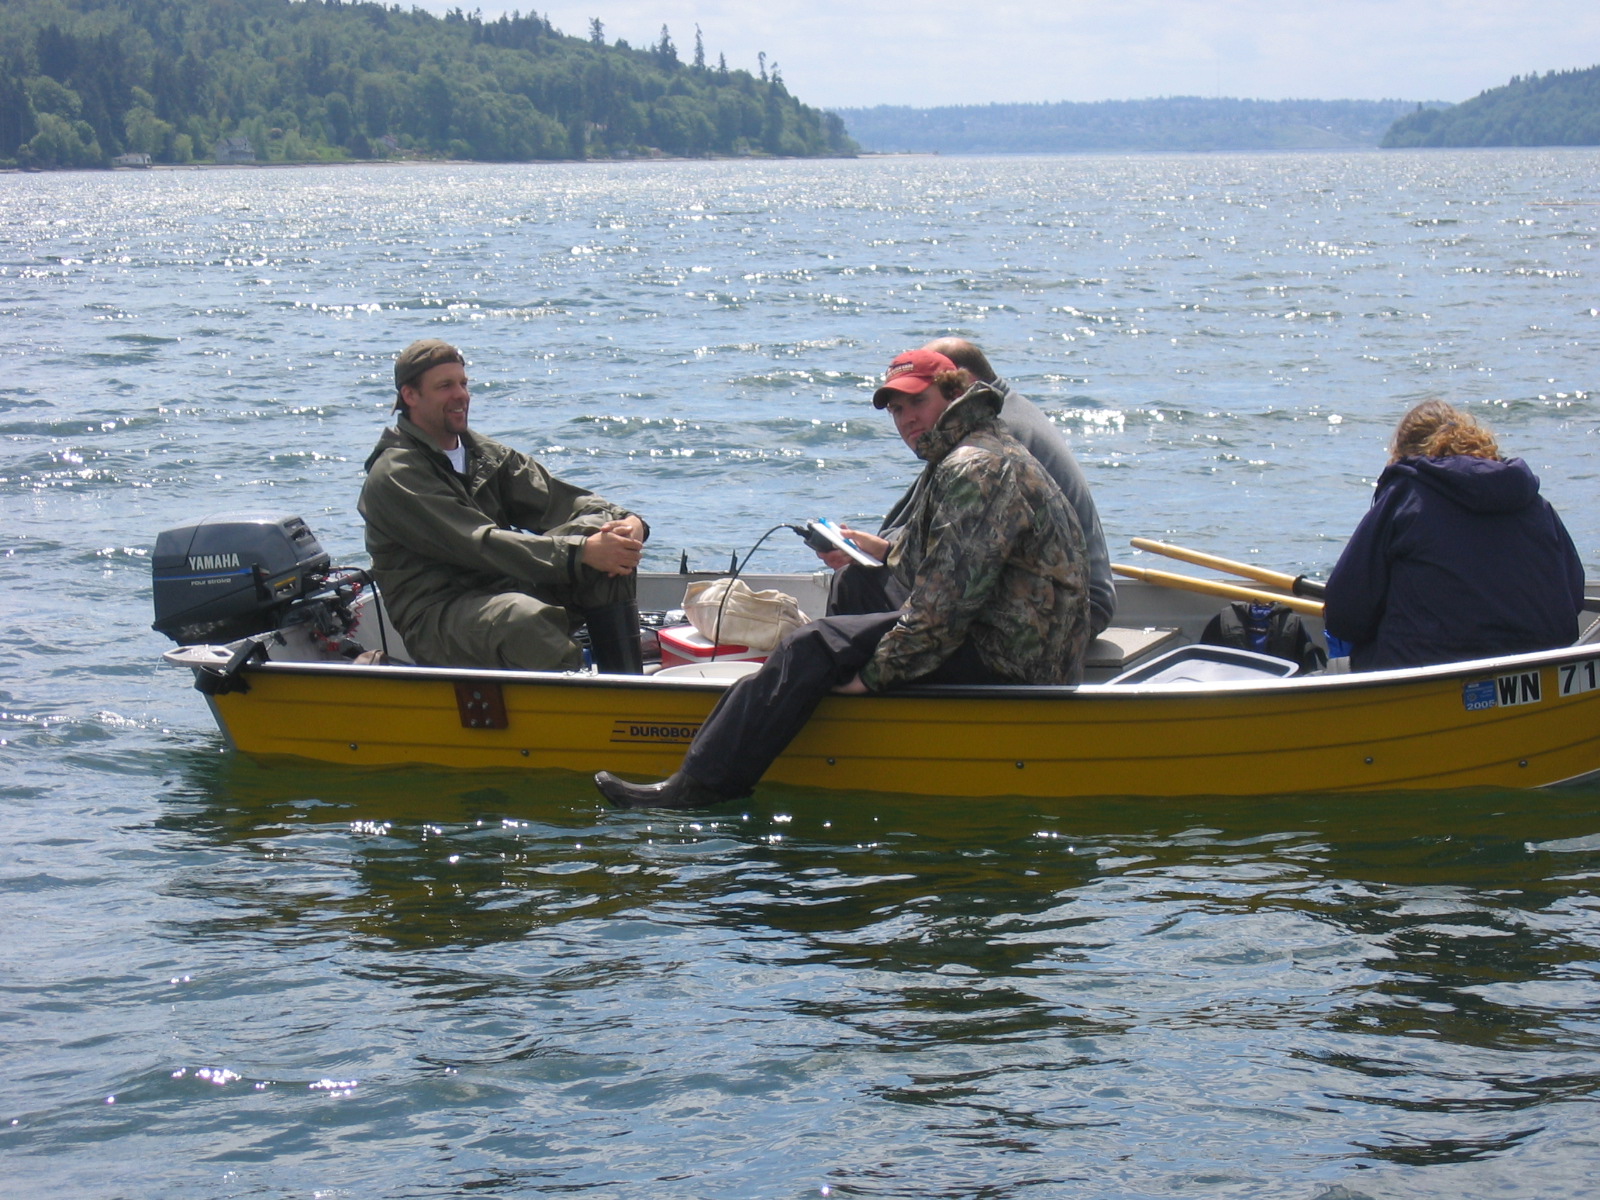
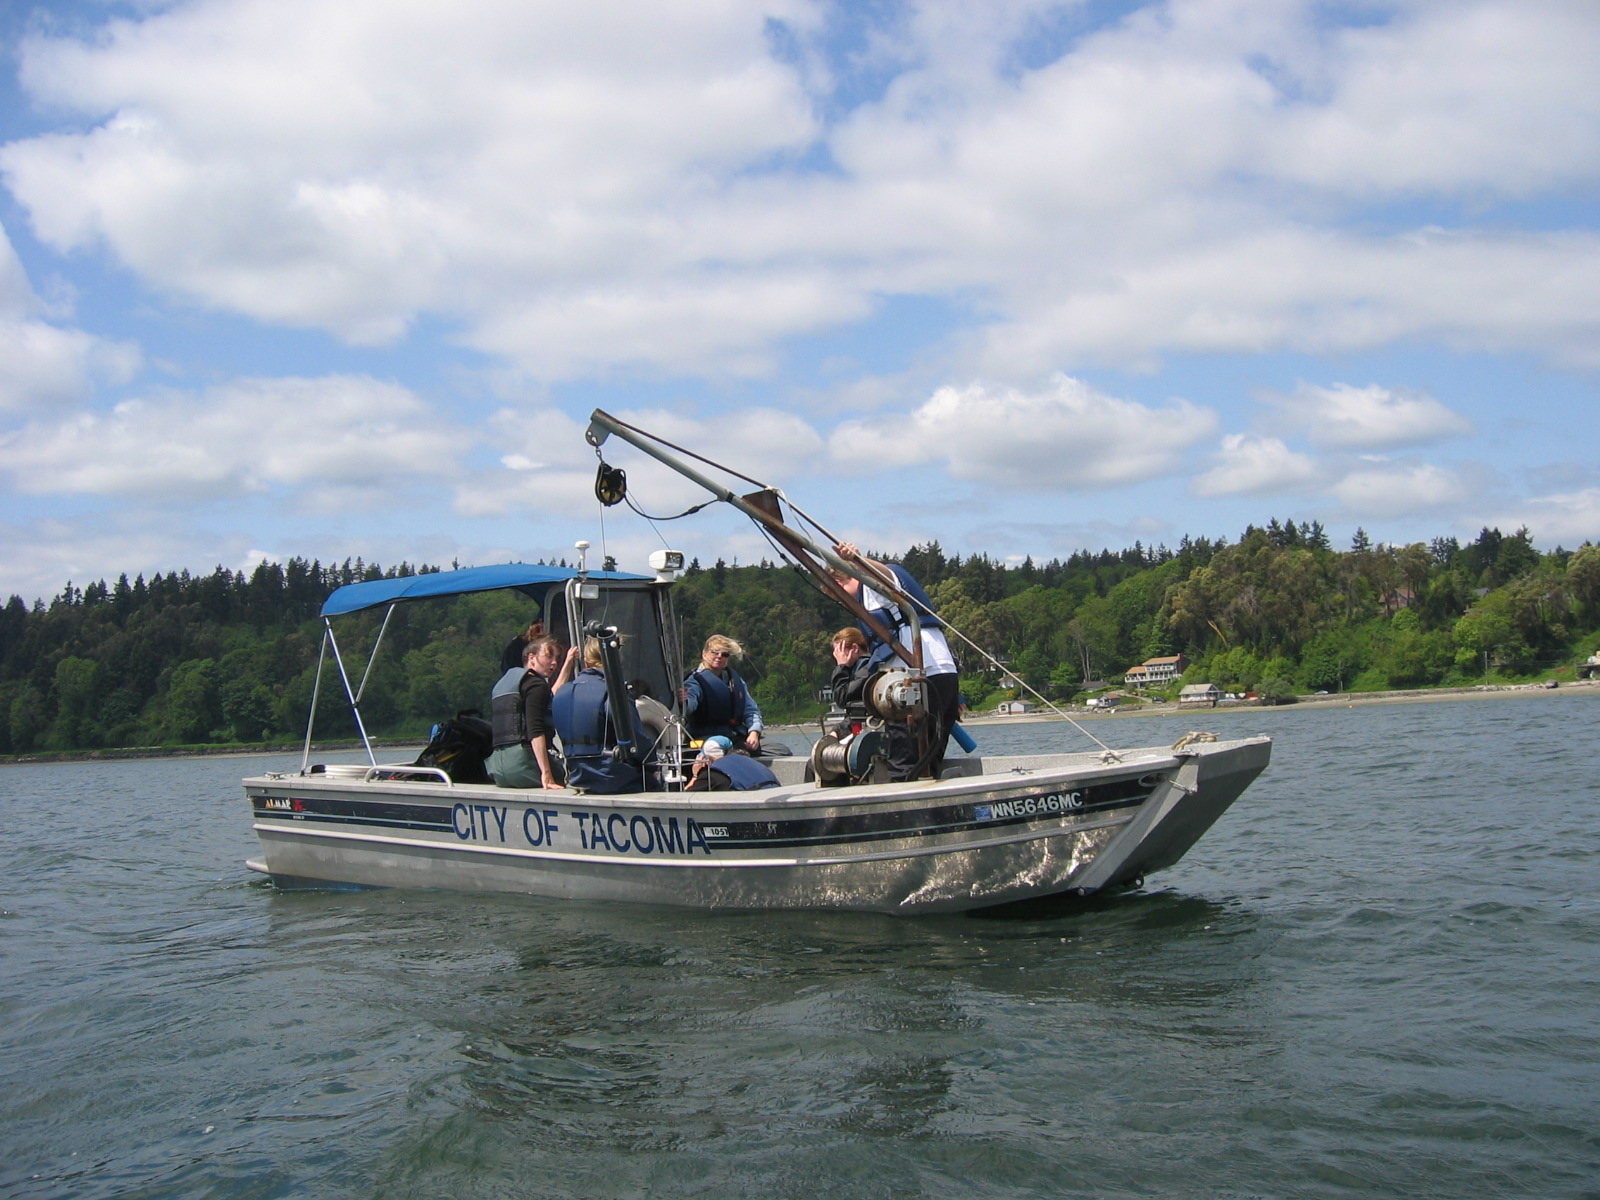
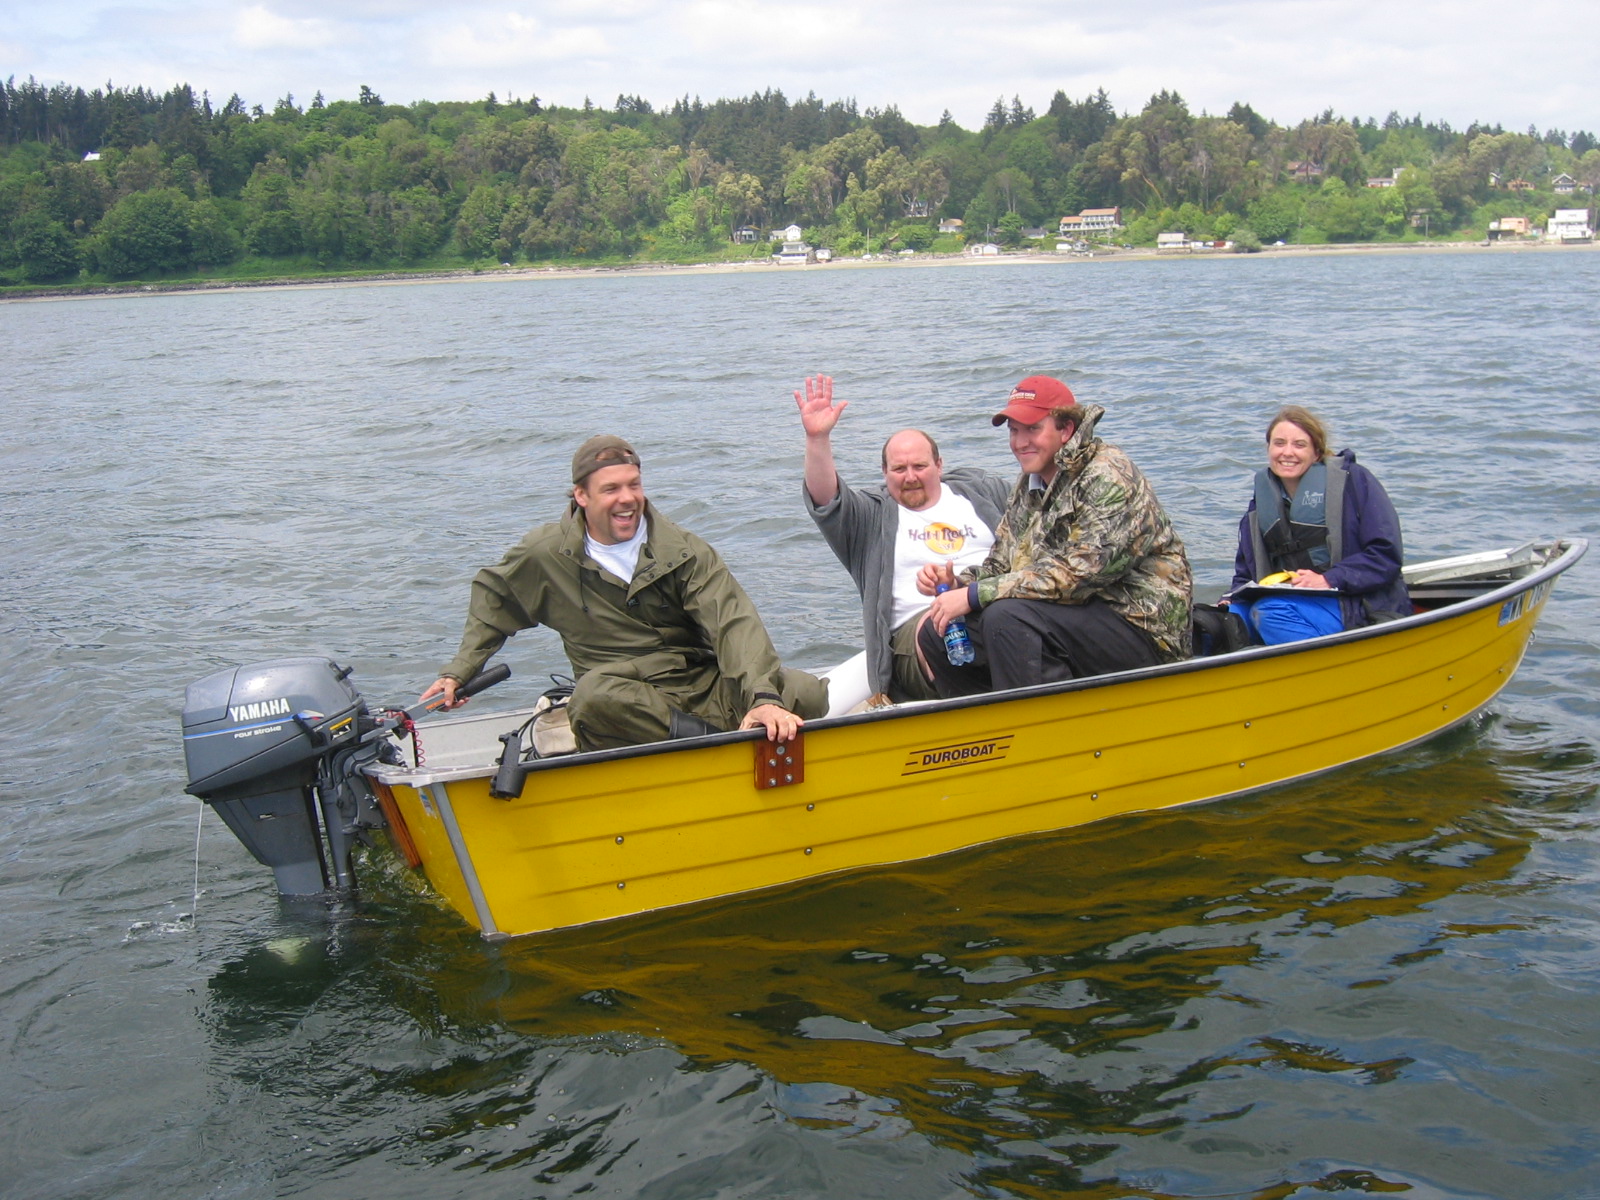
Because two boats were used to collect data, equipment and sample collection was divided between them. For specifics about which boat performed data collection and at what time, refer to masterlogs in data repository .
| TESC 431 Home | QMH Intro | Methods | Results | Plankton | Sediments |