Quartermaster Harbor

Results and Discussion

[Main] [Introduction] [Methods] [Data Repository]


CTD Temperature Profile
Degrees Celcius


CTD Temperature profile- Above is a water column profile showing the first 30 meters of depth in Quartermaster Harbor. Water temperature is determined through several variables including depth, salinity, amount of sunlight, ambient air temperature, water flushing rates and tidal action. Station 56 was in the inner harbor and exhibited the highest overall temperatures. As mentioned in the introduction the inner harbor receives a limited amount of flushing and has a large fresh water inlet. The low salinity, shallow depths and slow flushing times causes station 56 to be predictably warmer than stations further out in the harbor and Commencement Bay. As seen above, stations are colder at the surface the deeper and further out from the inner harbor due to the aforementioned reasons. There was a thermocline present at about 4 meters in stations 56-54 and at about 7 meters for stations 53-51 meters; At station 50 there was a thermocline present at 14 meters.

CTD Salinity Profile
PSU


CTD Salinity profile- Above is the water column profile showing the first 30 meters of depth in Quartermaster Harbor. The harbor as a whole has a small range of salinity with several isohalines. The entire harbor exhibits practical salinity unit (PSU) measurements in the brackish water category. The inner harbor is well stratified with a PSU of 25. There was a strong halocline at 3 meters in the inner harbor and was relatively undefined in the outer harbor at station 51 and 50. The undefined halocline was most likely due to rapid mixing in the deep water system caused by strong tidal and atmospheric conditions. At the surface there was a large freshwater layer resulting from a high level of precipitation in the days before sampling (April precipitation graph). Most notably about one day before sampling there was a large rainfall resulting in over 7mm of precipitation in a 24 hour period.

CTD Density Profile
Sigma t


CTD Density profile- Above is the water column profile showing the first 30 meters of depth in Quartermaster Harbor. The harbor as a whole mirrors the temperature and density profiles. This is due to density in marine systems being directly tied to salinity and temperature.

CTD Dissolved Oxygen Profile
mg/L

CTD VS Winkler


CTD Dissolved Oxygen Profile- Above is the water column profile showing the first 30 meters of depth in Quartermaster Harbor. The harbor as a whole is mixed with defined stratified DO levels. The CTD Oxygen measurements do not follow patterns exhibited in the other measurements. The DO measurements as a whole are indicative of a healthy harbor at that time (APHA 1992).

CTD Fluorescence Profile
mg/m3

CTD Flouresence VS Lab Chlorophyll


CTD Fluorescence Profile- Above is the water column profile showing the first 30 meters of depth in Quartermaster Harbor. The harbor as a whole exhibited low average fluorescence. There was an observed correlation between the low average fluorescence, DO data and the lack of observed algal blooms.

CTD Transmissivity Profile
% Transmission


CTD Transmissivity Profile- Above is the water column profile showing the first 30 meters of depth in Quartermaster Harbor. Transmission is a measurement the CTD takes by firing a laser between two points in the water column and reads the total difference of light between the two points. The harbor as a whole had a slightly lower transmission percentage with surface waters and had a homologous transmission percentage in all water below 3 meters.

Secchi Disk Profile


Secchi Disk- A secchi disk was lowered into the water column to qualitatively measure water turbidity. These measurements should coincide with CTD transmissivity data. This was not observed for unknown reasons but we postulate it was due to the atmospheric and tidal conditions at the time of sampling. The water was very rough with occasional white caps resulting in the research vessel moving quite a bit and the secchi moving horizontally within the water coloumn. Secchi Disk measurements are also qualitative and dependent on the researcher operating the equipment.

Quartermaster Harbor Nutrients

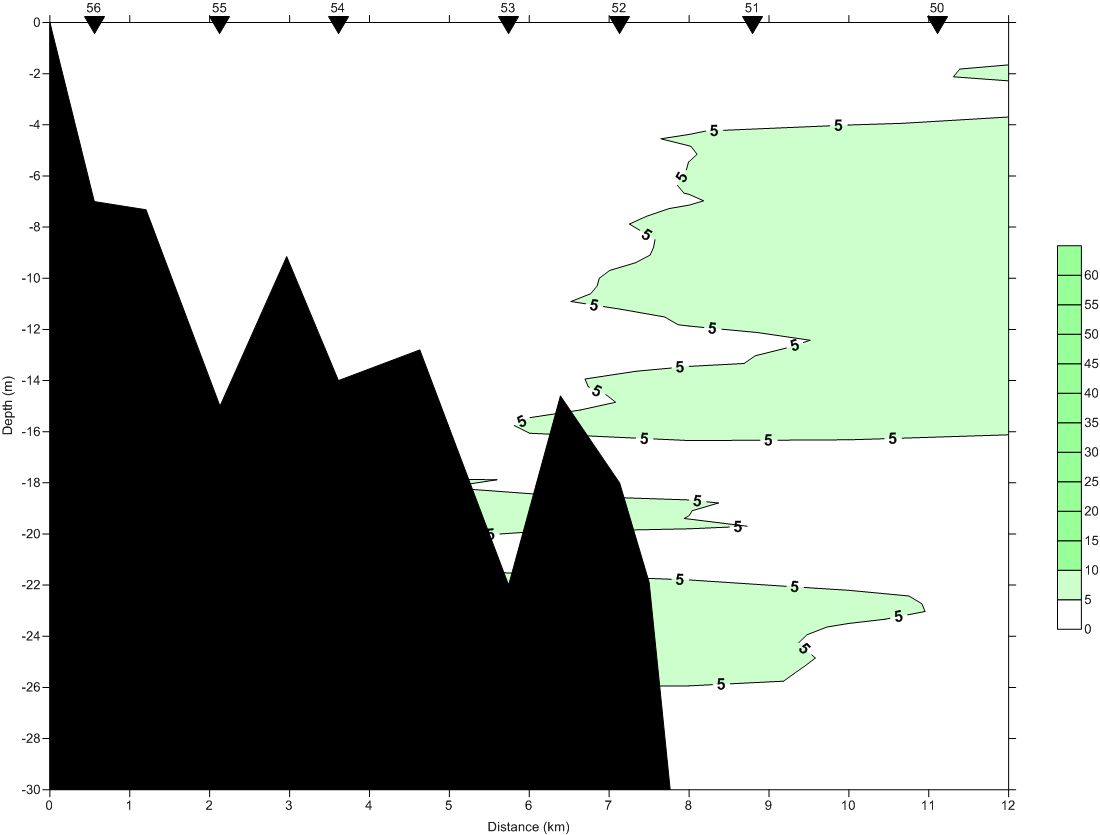
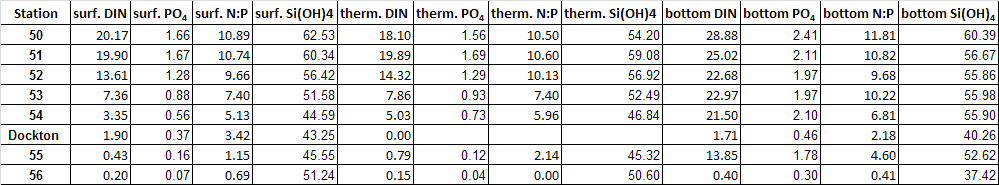
Five nutrients were tested within QMH waters. Nutrient samples were taken at three different points in the water column: surface, thermocline and depth. At Dockton thermocline nutrient samples were not obtained. Dissolved inorganic nitrogen (DIN) is most commonly found in marine waters in the forms of Ammonium (NH4), Nitrate (NO3), and Nitrite (NO2), of which all are primary sources of nitrogen for phytoplankton (Rensel 1991). Phosphate (PO4) is a primary source of phosphorous (P) for phytoplankton and is essential in metabolic processes. Phosphorous may be limited in areas highly influenced by rivers due to the high concentrations of nitrogen (N) carried in their waters (Rensel 1991).

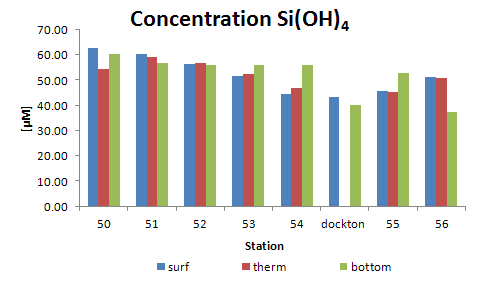
Silicic Acid (Si(OH)4) is incorporated into the cell walls of diatoms and is essential to their production (Rugdale et al. 2001). In periods of high phytoplankton production DIN, PO4 and Si(OH)4 are absorbed out of the system, in turn reducing concentrations.

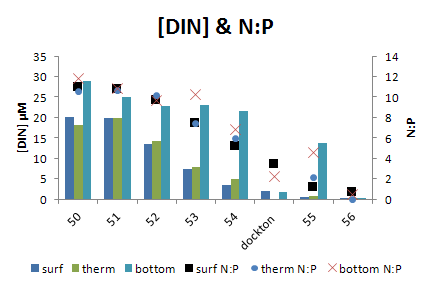
Phytoplankton generally absorb N and P at a ratio of ~15:1, which is also the average ratio maintained in seawater. The balance of N and P which phytoplankton need vs. what is available in seawater is thought to be ecologically driven (Broecker et al. 1982).

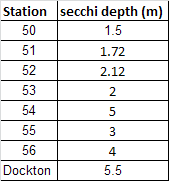
Throughout QMH we saw decreasing levels of nutrients towards the inner harbor. Fluorescence was low throughout the harbor as well as low N:P towards the inner harbor. These data both suggest a recent bloom must have died out of which nutrient levels have not since rebounded. The outer stations had the highest concentrations of PO4, therefore riverine influence was not a factor for QMH at this time.


Phytoplankton Concentration
Representing % abundance in the water column sample


Phytoplankton Concentration and Abundance- Phytoplankton is the bottom of the food chain for the oceans and the corner stone upon which the marine food web is based. By measuring phytoplankton amounts we are able to get a relative measure of ocean life, nutrient levels and possible contamination, algal blooms or other detrimental features which may be present in the water column. At each station phytoplankton counts were slightly higher in the thermocline than at the surface. This was expected due to the lower salinity at the surface. The station with the highest total abundance of phytoplankton was Dockton. Detonula spp. had the highest overall concentration and abundance across stations. No algal bloom was present at any station. Low nutrient concentration and a low N:P ratio throughout the harbor are indicative of low phytoplankton productivity. It is postulated these nutrients may have been exhausted in a previous bloom before the sampling day. Phytoplankton data is supported by the lack of high DO concentrations and low fluorescence.


Sediment and Total Organic content

>

Wide variances were observed between stations for collected sediment and total organic content (TOC) samples. Stations 53 had a good mixture of clay, very fine sand and fine sand. Station 55 had a majority of silt, and station 52 had a relatively even mixture of fine sand and medium sand. TOC related to these follows what is expected. Station 55 had the highest TOC of stations that also had a grain size analysis and station 52 had the lowest. Grain size could not be determined for the Dockton sediment grab due to a high concentration of small shells present throughout the sample. The inner harbor is a depositional environment with slow flushing rates while the outer harbor is relatively faster at flushing water out. The difference in flushing results in the inner harbor having a relatively high amount of fine grain particulates; such as clay and silt. Conversely the faster flushing rates result in the outer harbor having a larger average grain size and a high concentration of sands.

[Main] [Introduction] [Methods] [Data Repository]


Created by Michael Barnett and Ian Reeber