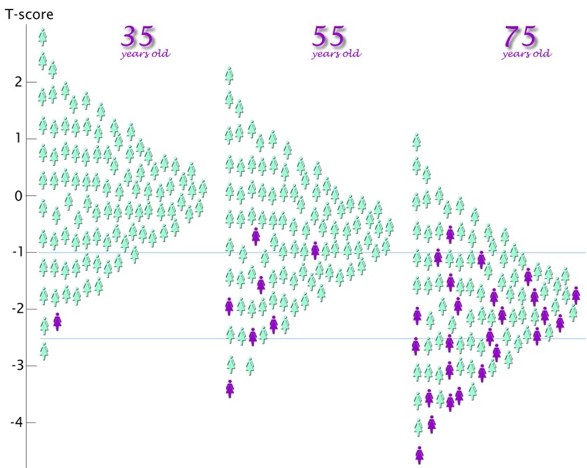
If I took 100 ordinary women at each of three ages (35, 55 and 75 years) and lined them up according to their bone density, they would stand like this. The ones in purple would have a fragility fracture within the next ten years. (Kanis JA)
| Hip fracture risk vs age, according to z-score |
 women |
 men |
|---|---|---|
| Hip fracture risk vs age, according to t-score |
 women |
 men |
| Hip fracture risk vs BMD according to age |
 Femoral neck |
 Total hip |
The following graphs are from the Study of Osteoporotic Fractures. Note that they reported the 5-year risk of fractures, whereas the meta-analysis reported 10-year risk. Because the women in SOF had serial xrays of the spine, the vertebral fracture rate could be reported. (Cummings) JAMA 2002; 288:1889-97
 |
 |
 |
| You can also use the Fracture risk calculator to estimate the fracture risk based on the bone density. |

|
Hip fractures are the most definite fractures to count, and they are also the most serious fractures, so most of the graphs here show the risk of a hip fracture.
In general the DEXA of the hip (either total hip or femoral neck) is the best predictor of both hip fractures and spine fractures. Bone density in an individual usually has about the same relative value at the hip and spine. However, if there is a discrepancy, then the hip bone density is more predictive of hip fractures and the spine density more predictive of spine fractures.
 More graphs about discordance between spine and hip bone density
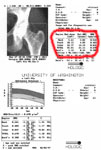
| Click on the figure to learn about reading the bone density from the printout which comes from a densitometer. |
Updated 2/10/16