| Growth Modeling | 10 |
LMS Inputs |
LMS also contains tables and chart functions that will process stand and landscape data to produce output summary tables. It will subsequently visualize either the landscape or an individual stand.
LMS requires descriptive timber inventory and site information for each stand (from the final timber coverage’s attribute table for example). A Digital Terrain Model (DTM) must also be included for visualization purposes. The four files that are required by LMS include the inventory file, the stand database file, the scenario file and a stand boundary arcmos file. Each file is extremely format sensitive. All of the necessary files may be created by using a conversion aml written by Forest Engineering senior, Luke Rogers. See data library for details. LMS requires the user to specify a regional variant. For the upper Washougal, the West Cascade Gifford Pinchot variant was used in order to generate the most realistic model of the area.
The inventory file describes the individual tree inventory for each stand. The file contains at least two lines of data, beginning with the stand identification number. Each line contains a species, diameter, height, crown ratio, trees per acre expansion factor, and the volume per tree. See the appendix for all file forms and examples.
The stand database describes static stand-level site characteristics for each individual stand such as location, site index, age, slope, aspect, elevation, and acreage. One line of comma separated variables is required per stand. It is assumed that each stand is represented by one plot. Latitude and location variables do not affect the modeling.
The silvicultural prescriptions are controlled by the scenario file, which specifies what silvicultural regime will be applied to the stand. This file specifies how much to be harvested according to diameter class and age. The scenario file also designates what kind of replant occurs after a treatment. Each plant file requires the same items as an inventory file. It is also possible to call upon a natural regeneration simulator using a *.key file which interacts directly with the FVS program. All files listed in the above three paragraphs are combined to form a portfolio used by LMS. The portfolios used in this project can be found on the CD titled "Washougal 98" that accompanies this report.
LMS Outputs |
Volume Data
After growing the landscape under different management regimes, LMS provides individual stand summary tables. These tables include the heights, diameters, expansion factors and cut and standing volumes that it has projected over a specified time. LMS also creates these tables for the entire landscape by averaging the individual stands. Data about these changing attributes is available in either chart or table form. For example, the chart below is the standing volume, average TPA and average DBH summary for the Washougal planning area over 25 years under a no harvest scenario.
Table 10.1 Total Landscape Volume Under No-Harvest Scenario
|
Year |
Total Volume (MBF) |
DBH (in) |
TPA |
|
1998 |
1794716 |
8.07 |
346 |
|
2003 |
2374139 |
8.83 |
335 |
|
2008 |
2814502 |
8.90 |
326 |
|
2013 |
3056215 |
9.54 |
313 |
|
2018 |
3142572 |
9.90 |
301 |
|
2023 |
3452817 |
10.48 |
290 |
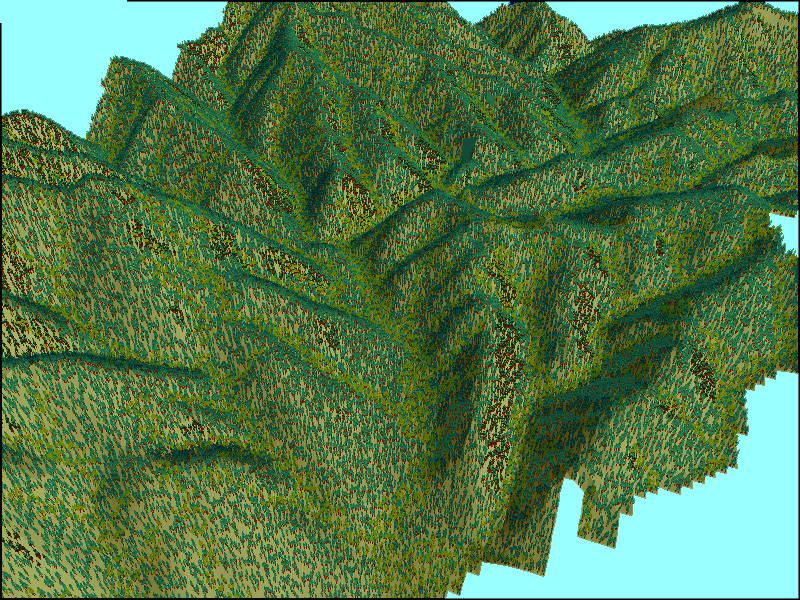
LMS visualization drivers also allow the user to view either individual stands through SVS or the whole landscape through UVIEW in order to communicate possible visual impacts of various silvicultural strategies. Below is an example of the 1998 landscape under passive management.

Figure 10.1 Visualization of the upper Washougal from the SE end of the planning area
Design Information
In order to identify other crucial outputs, Jim McCarter of the UW Silviculture Lab wrote a python script program to create a table to identify the HCP requirements, tail tree diameters, payload weights, and growth rates. The python script table makes it possible to view each component of the HCP dispersal habitat criteria in order to recognize which parameter is limiting. The program then assigns a zero to the stand if it is non-habitat and a one if it has reached habitat.
The tail tree estimates are based on the assumption that a cable corridor is 150’ wide (Chapter 8). With this spacing, a 90’ tolerance is acceptable for the tail hold, which translates to 5 trees per acre. The tail tree estimate therefore is the quadratic mean diameter of the five largest trees per acre as we assume that these trees are the most likely to be used. Once the existing tail tree capabilities are calculated, it is possible to check the following Table 8A.6 to see if the trees are able to support the cable logging specifications set by PLANS. This table shows what diameters are necessary for specific cable capacities at three different rigging heights. This table is essential as tail tree diameters were calculated at breast height.
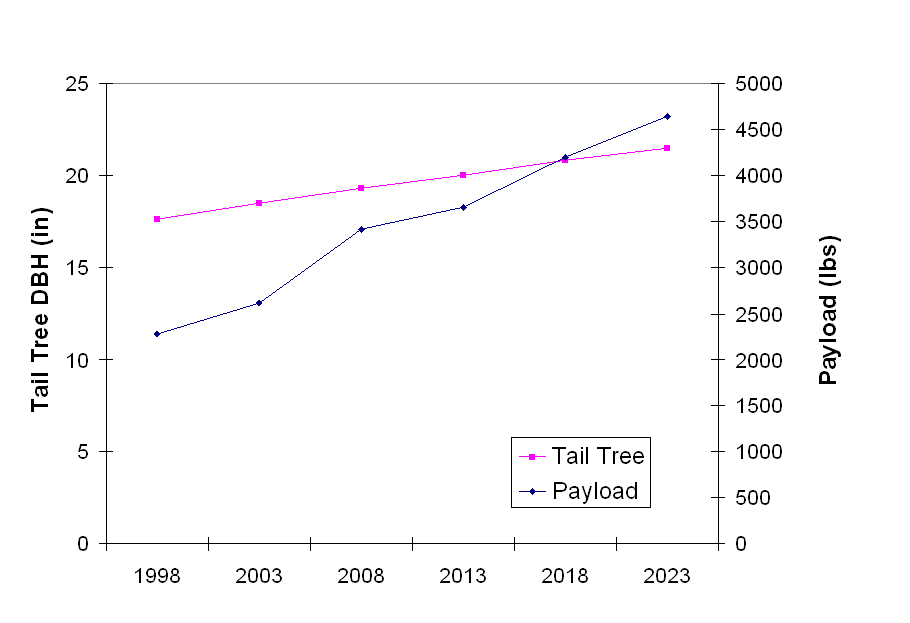
Payload estimates were derived from the assumption that there are usually three logs per turn. With a value of 12 lbs per bdft for green Douglas fir, the average log weight was calculated. This weight was multiplied by three to represent the turn. The following graph shows the change of payloads and tail tree diameters over the next 25 years.

Figure 10.2 Tail Tree and Payload Estimates based on "no harvest" inventory
The payload, tail tree diameters, and volumes per acre are now available to be printed on each individual setting on field maps for convenient scheduling reference.
Potential Errors |
The Washougal planning area is likely at the extreme low end of growth for the state of Washington. The unique fire history and terrain differentiates it from even the surrounding watersheds. Consequently, even though growth data for the Gifford Pinchot variant was gathered near the planning area, it may not be an accurate model. It must be assumed that the outputs for every five-year period may be on the high end.
LMS also may not have been able to accurately model stand development due to the high wind shear, which has stunted height growth. There is no way of modeling wind effects within LMS. Although field reconnaissance showed that little height was gained after a 9 inch DBH, LMS will continue to increase heights over time. This also may have falsely raised diameters, volumes, and most importantly, habitat percentages within the watershed.