14 Road Management Strategies
14.1 Sedimentation
The sedimentation model SEDMODL was used to determine the future sediment
generation and delivery for the particular roads chosen to be used by SNAP.
The sedimentation model was completed for Periods 1 -3.
During the analysis, the volume of timber to be hauled over the road that
SNAP provided was used as a value for the category of road use. The results
from SEDMODL are relative numbers because of the coding of the attributes
within the transportation layer. SEDMODL is capable of generating accurate
results if the input data is accurate and reliable, but due to time constraints,
the values were not changed to reflect the many different attributes of
the roads within the area. The UW derived stream layer was used for the
stream input within the sedimentation model and results were amended according
to the prediction rate of the derived streams as seen in Chapter 5.7.1.
The values used for road use applied within the SEDMODL from the timber
volume passing over each road segment are shown in Table 34.
Table 34.
Values used in SEDMODL Road Use Category. Timber volumes were provided from
SNAP and assigned a value within the sedimentation model.
|
Timber Volume Hauled over a Road Segment (MBF)
|
SEDMODL Road Use Classification
|
|
0
|
None
|
|
0-1500
|
Occasional
|
|
1500-4000
|
Light
|
|
4000-10000
|
Moderate
|
|
> 10000
|
Moderately Heavy
|
The sedimentation results for Periods 1-3 can be seen in Table 35. These
results were reduced based on the results from the derived stream networks
overestimation rate of 26 percent.
Table 35.
Sedimentation results for Periods 1-3. Road sediment is estimated in tons
for delivery areas.
|
|
Period 1
|
Period 2
|
Period 3
|
|
Total Estimated Road Sediment (tons)
|
120
|
135
|
185
|
|
Estimated Road Sediment per Mile (based on indirect delivery)
(tons)
|
1
|
1
|
2
|
|
Estimated Tread Sediment (tons)
|
22
|
31
|
110
|
|
Estimated Cutslope Sediment (tons)
|
98
|
104
|
75
|
|
Background Sediment Total (tons)
|
1834
|
1834
|
1834
|
The sediment estimates for road segments were generated from delivery areas.
The delivery areas are located where roads cross streams. The indirect delivery
areas are roads located within 200 feet proximity to a stream and only deliver
a fraction of the sediment generated. Figure 68 through Figure 70 show the
road used for truck haul during each of the periods and the road segments
that will potentially deliver to the streams.
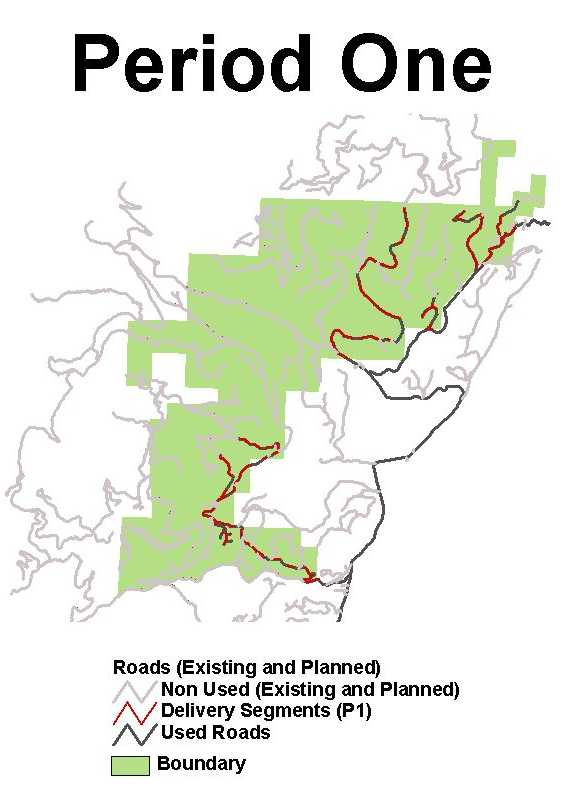
Figure
68. Roads used for truck haul during period one of the SNAP results.
Roads that are used are shown in black with the sediment delivery portions
shown in red.
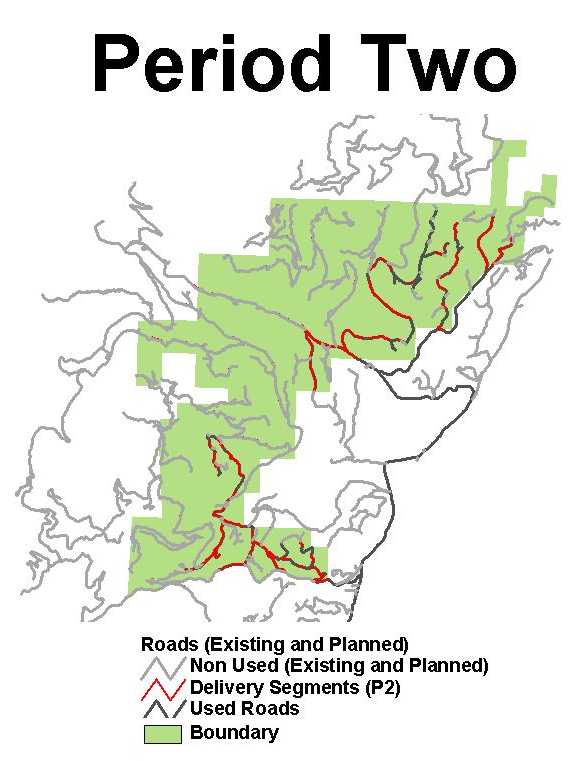
Figure 69. Roads used for truck
haul during period two of the SNAP results. Roads that are used are shown
in black with the sediment delivery portions shown in red.
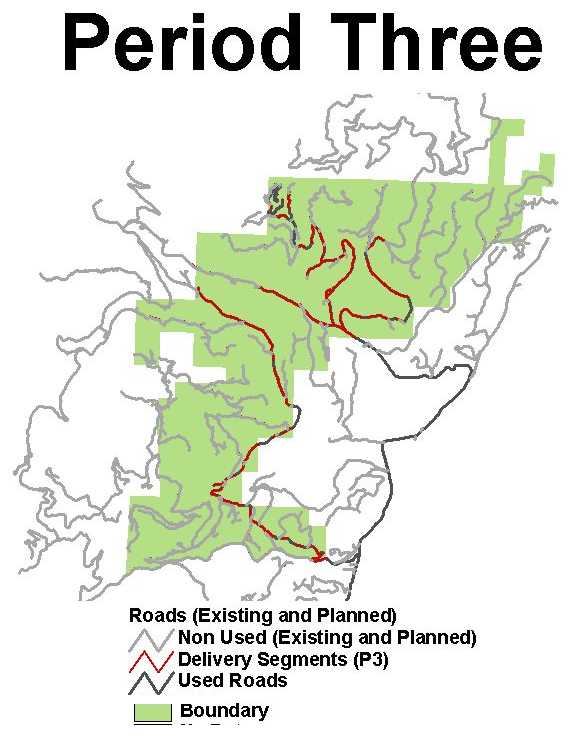
Figure
70. Roads used for truck haul during period three of the SNAP results.
Roads that are used are shown in black with the sediment delivery portions
shown in red.
The sediment amounts generated for these three periods are different based
upon the number of stream crossings for each road used and the amount of
use that each road segment gets from the amount of timber volume travelling
across it. Within each period the number of active and inactive roads is
relatively close as seen in Figure 71.
Figure
71. Number of active, inactive and total miles open for periods 1-3.
When the sediment generated during these periods is shown with the total
miles of road that contribute to sediment delivery, it shows that the roads
used in combination to the amount of use these roads get will determine
the amount of sediment delivery potential. This comparison can be seen in
Figure 72.
Figure
72. Total miles of open roads (shown in the bars) and sediment delivery
from these roads (shown in the line) shown for each period.
Sediment is an important issue for water quality and fish habitat. Using
SEDMODL for road planning and maintenance can aid in the reduction of sediment
generated and delivered. Variable tire pressures (VTP) can further add to
the reduction of sediment generated. VTP can reduce current sediment generation
from 5 to 70 percent. This reduction is determined by road grades and cross
drain spacing through a program called VTP. The use of variable tire pressures
however adds additional costs to roads for installing and maintaining air-pumping
stations at entrances to the forests or by having a mobile compressor at
individual timber sales.
14.2 Road Maintenance and Use
We have derived a schedule of proposed settings and roads for five periods
covering the next 25 years. This schedule was derived using SNAP (Chapter
13) with details on what roads will be used for truck haul and the amount
of use they will receive given by a volume of timber that will travel over
the road way. The specific road segments used during each period can also
be seen in Chapter 13.2 including roads that never were used or built.
The use of certain roads and therefore the maintenance needed can be visualized
with a map of the volumes of timber that will pass these road segments throughout
the five periods seen in Figure 73.
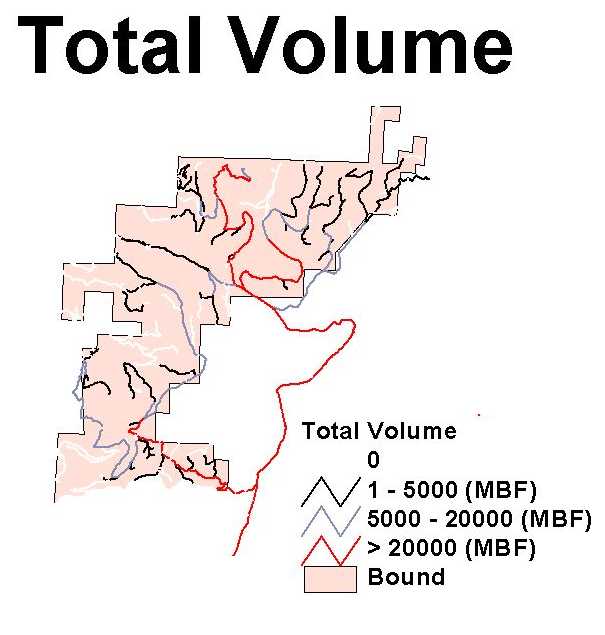
Figure
73. Road use classified by volume of timber hauled over the roadway
during the next five periods. Roads in white were never used or built during
the 25-year planning period
The roads in the above figure were isolated by the amount of use they received
from timber haul. Roads with less maintenance needs or none at all are roads
shown in white which were never used and/or built and black roads, which
were only used for a few timber sales. Grey and Red roads will need increased
maintenance compared with some of the others as they are used for more timber
sales and mainlines. For further estimate of maintenance needs, SEDMODL
can be used to analyze the amount of sediment generated if the road was
closed to truck travel and used only for administrative travel or used for
multiple timber sales. One example of the aid in maintenance issues that
the sedimentation model can provide is shown in Figure 74. The main problem
with road maintenance and sediment delivery is stream crossing culverts.
Figure
74. NE corner of planning area. Roads of concern are located in the
upper left corner with no stream crossings and upper right corner with 11
stream crossings.
The K-17 road located in the northeastern most portion of the planning
area (the upper left corner of Figure 74) is located primarily on the ridgetop,
is almost two miles long and contains no stream crossings. It is however
within 200 feet proximity to a stream. The K-13 road also located near the
northeastern corner of the planning area (the road in the upper right corner
of Figure 74) is a midslope road, one mile in length and crosses 11 streams.
Figure 75 and Figure 76 show the road delivery segments for the K-17 road
and the K-13 road, respectively.
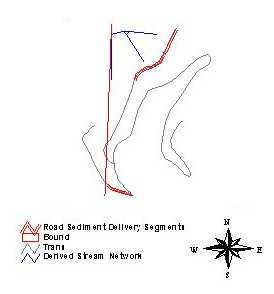
Figure
75. The K-17 road shown in grey with sediment delivery segments shown
in red.
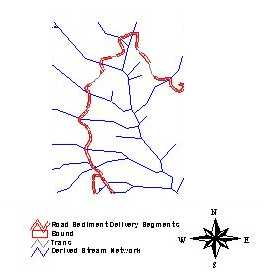
Figure
76. The K-13 road shown in gray with sediment delivery segments shown
in red.
These two roads were analyzed in SEDMODL for their sediment delivery amounts
using two different road uses, active truck haul and tank-trapped with no
use. The results for these two roads can be seen in Table 36.
Table 36.
The sediment delivery potential from two roads, K-17 and K-13, in tons of
sediment per year. Within SEDMODL, two different road uses were analyzed,
tank-trapped with no traffic and active with truck haul.
|
Road Name
|
Sediment Generated from Non-Use (Tank-Trapped)
(tons/year)
|
Sediment Generated from Active Truck
Haul
(tons/year)
|
|
K-17
|
0
|
.04
|
|
K-13
|
3.9
|
9
|
From this example, road length is not accurately indicating the sediment
delivery into streams. The K-17 road does not contain any stream crossing
culverts that will need excessive maintenance, lowering the maintenance
cost on the road and not adding noticeable sediment to streams. The K-13
road however, will need preventative maintenance in either situation to
prevent sediment delivery into the many streams, increasing the cost to
maintain the road. The number of stream crossings will allow better prediction
of sediment delivery, maintenance needs and impacts on water quality and
fish habitat issues.
With this in mind, at times it may be cost efficient and important to reduce
water quality impacts by deactivating a road. Using the costs provided by
the DNR, Table 37 and Figure 77 shows the cost analysis of maintaining a
road.
Table 37.
DNR provided road costs.
|
Road Maintenance Activity
|
Cost
($ / station)
|
|
Construction
|
1850
|
|
Reconstruction
|
250
|
|
Maintenance for Active Road
|
17
|
|
Maintenance for Inactive Road
|
8
|
|
Inactivation
|
26
|
|
Abandonment
|
90
|
Figure
77
. Cost graph of road maintenance options.
Figure 77 shows the cost of inactivating a road, pulling out culverts and
tank-trapping, to equal the cost of actively maintaining a road around year
23. For analysis purposes, the road was inactivated at year 2. If maintenance
costs were increased, the "break-even" point of inactivating and then reconstructing
the road would decrease. This shows that for sediment delivery and cost,
if a road was not to be used between fifteen to twenty years after construction,
it may be in "the best interest" to inactivate the road.
14.3 Abandonment, Decommisioning and Deactivation
Reducing road density and road impacts on water quality and fish habitat
is an important issue. Using SNAP to schedule the road system usage and
SEDMODL to estimate sediment generation and delivery will assist in deciding
which roads need extra maintenance and which roads should be taken out of
the system. Figure 78 shows the final road system from SNAP for the 25-year
schedule.
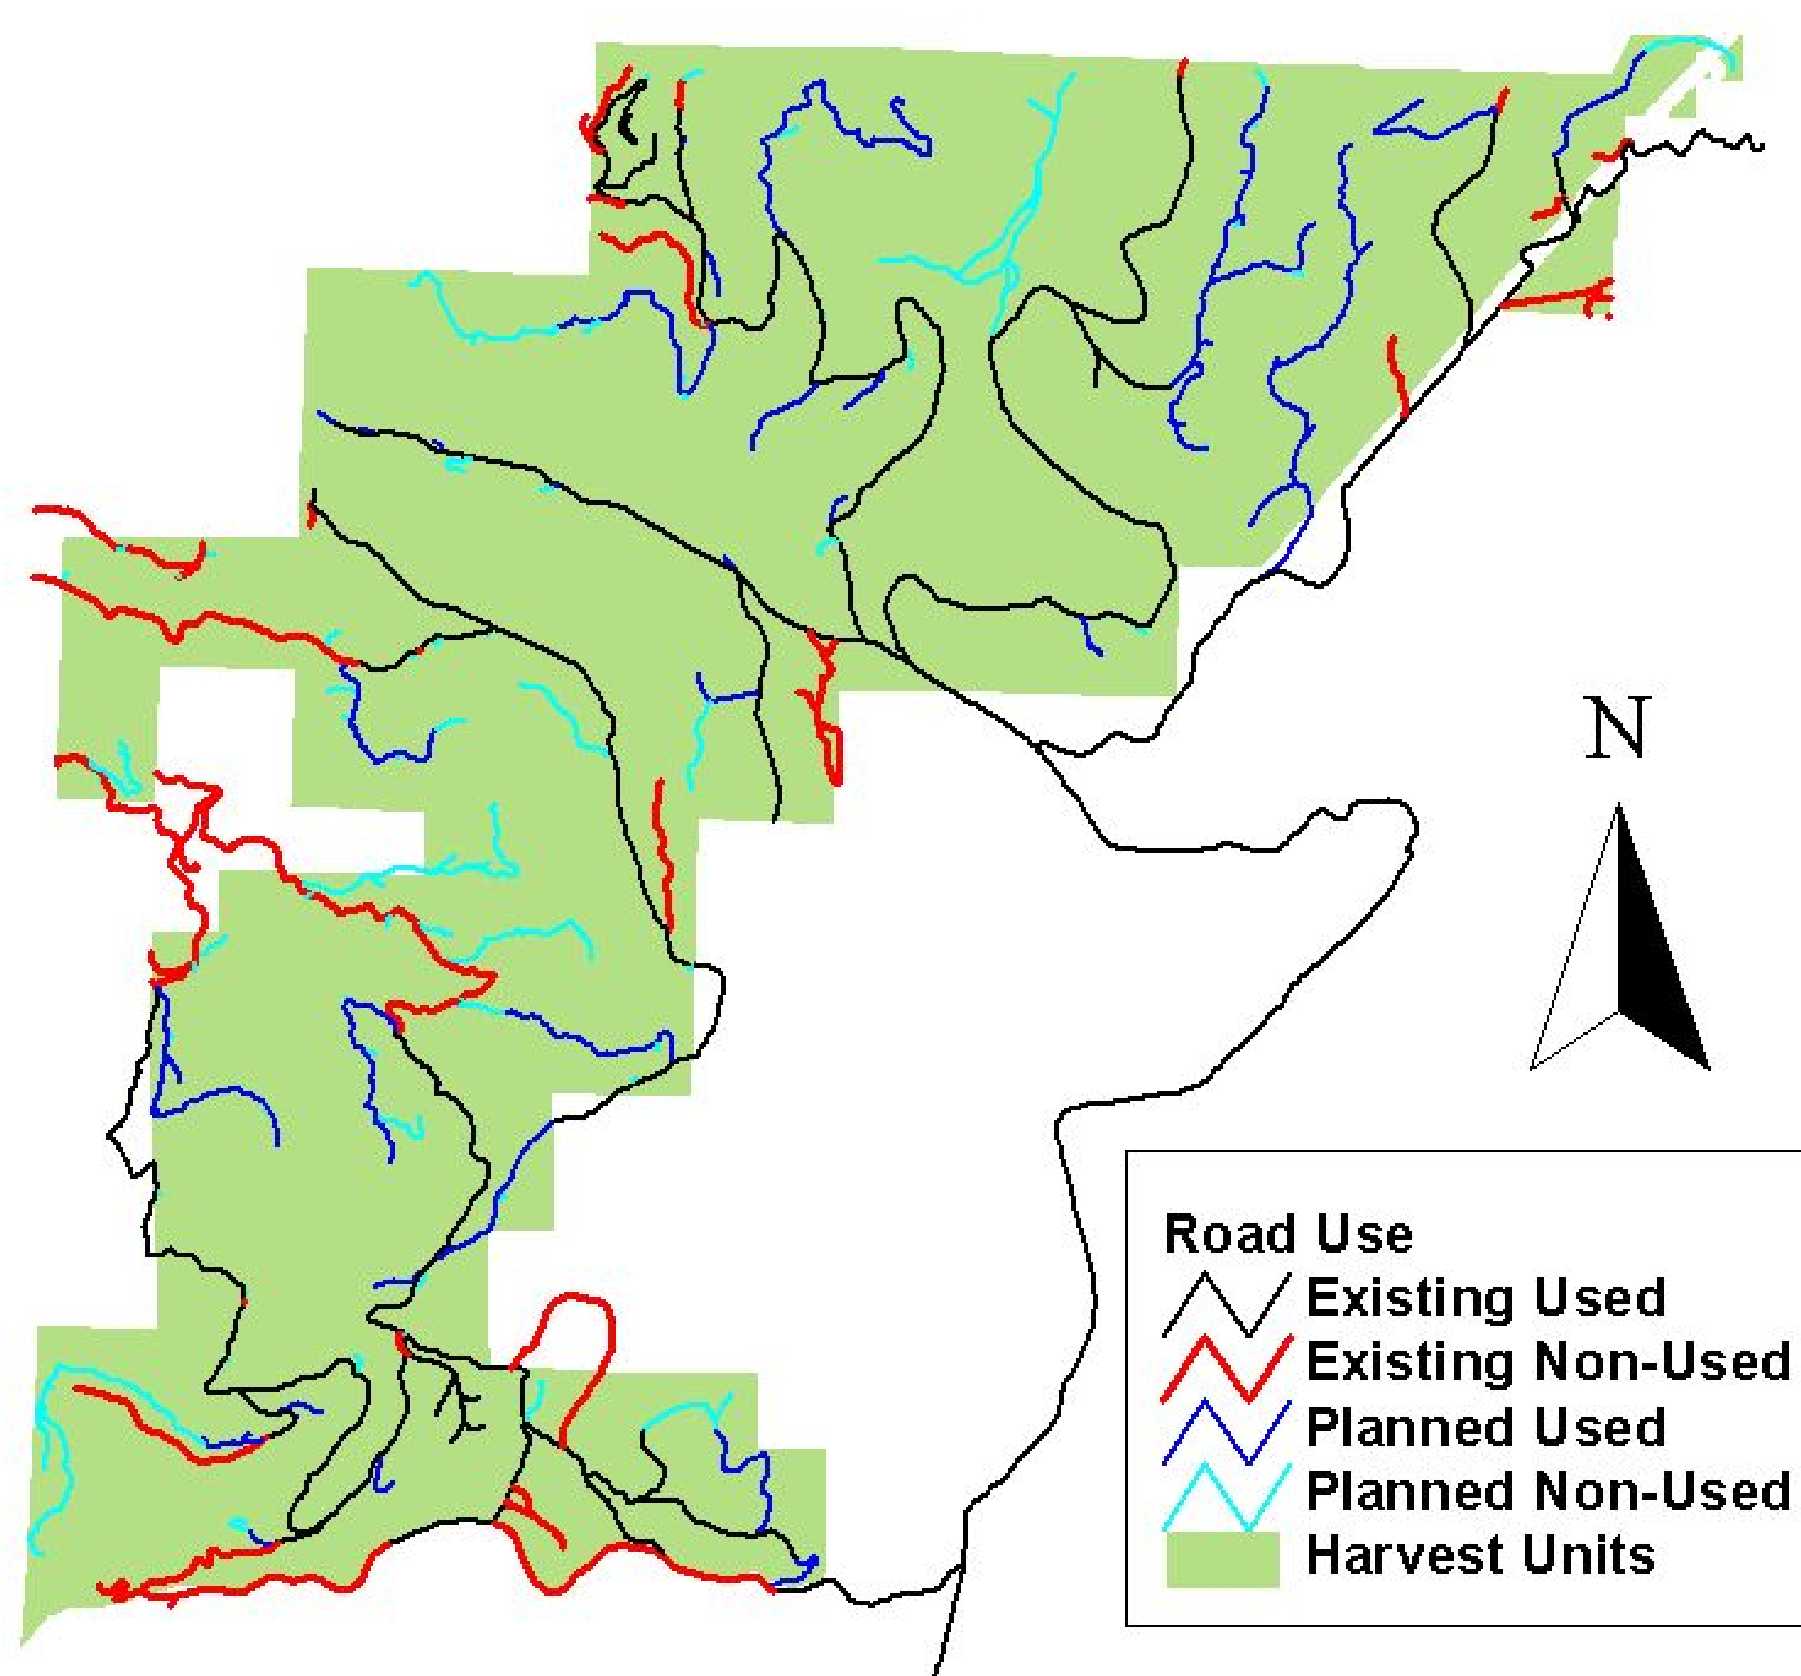
Figure
78. Final road system for the 25-year schedule developed by the UW.
The roads shown in red are existing roads that are not used within the
25-year period. These roads would be possible candidates for inactivating
or decommissioning, although some of the major roads are primarily Forest
Service roads. The Wes road and the portion of the J-2 road are probable
choices for deactivating by pulling the culverts out to reduce excess sediment
delivery into the stream network. Most of the Wes road located above the
second bridge washout is in good condition with a few culvert locations
(see road inventory reports for FS-14) while the non used portion of J-2
crosses numerous streams and contains a broken concrete culvert adding more
sediment to the stream network.
Additional consideration to the deactivation of roads based on the "break
even" analysis in Chapter 14.2, and sediment delivery potential in Chapter
14.1, should be looked at for roads that are only planned to be used during
one or two periods. Figure 79and Figure 80 exhibit roads that are only used
during period one or period two and then there is a minimum of 15 years
before they will be used again.
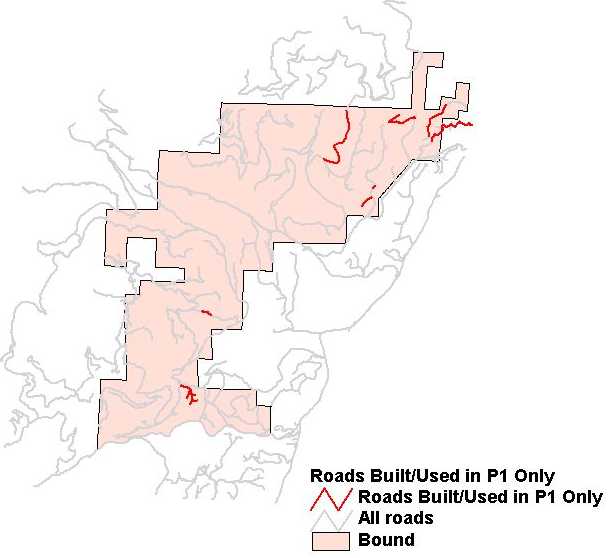
Figure
79. Roads used during period 1 only.
The roads depicted in Figure 79, except for the Forest Service Web Mountain
road, are small segment roads that are not needed for future road use and
could be built as spur roads. Once the road has been used for the sale,
they could be pulled back completely, keeping the road density and sediment
delivery to a minimum.
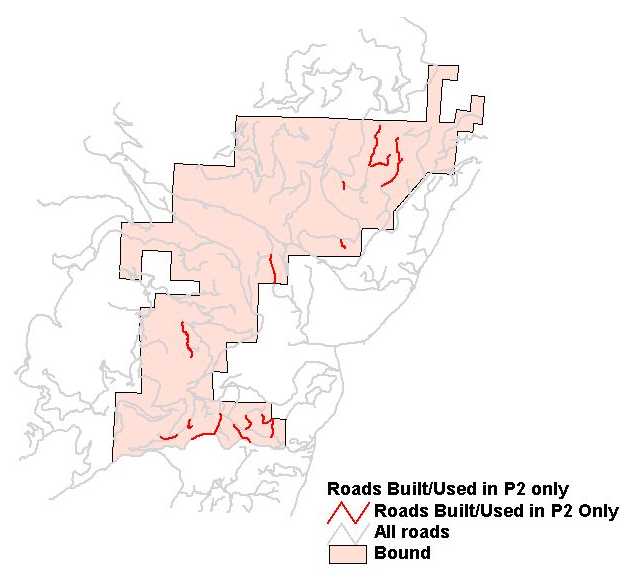
Figure
80. Roads used in period 2 only.
The roads shown in Figure 80, could be treated the same way as the roads
shown in the previous figure, with the exception to the Forest Service owned
roads. There are more roads used in period 2 that cross numerous streams.
These stream crossings contribute more sediment to streams then longer,
more used roads that do not cross streams.
Figure 81 shows the "Shirt Pocket" road that is used in period 1 and again
in period 5. This road would be a good possibility for inactivation during
the 15-year non-use period.
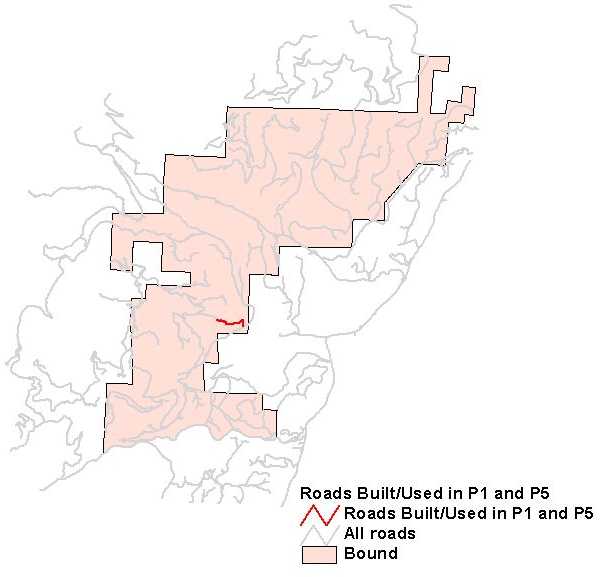
Figure
81. Roads used during period 1 and 5 only.
Lastly, Figure 82 shows two roads that are not used for 15 years. These
two roads, especially the road located in the northern section of the planning
area, could be considered for inactivation for the non-use period. Portions
of both roads contain sections of erosion to road surfaces and culvert locations.
There are large amounts of sediment being delivered from the stream crossing
locations that should be inactivated with some maintenance on the culvert
locations (see road inventories on J-23 and K-13RR roads).
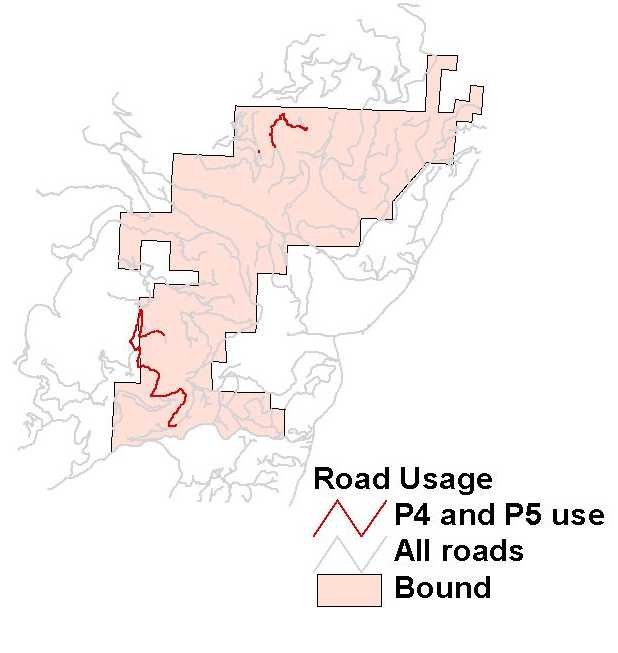
Figure
82. Roads not used for 15 years.
Back | Cover
Page | Table of Contents | Next