Estimation of tail tree diameters was done with a modified version of a script developed for LMS, Landscape Management System, developed at the University of Washington, (http:\\silvae.cfr.washington.edu) for the 1998 Forest Engineering project. This script calculates the quadratic mean diameter (QMD) for the largest 2tpa and largest 18tpa for any or all of the RIU polygons on the landscape. These values were based on the assumptions that a yarder running a live skyline using either a gravity carriage (shot-gunning) or butt-rigging and rider block with 20' long chokers could reach all the trees needed to log 25' to either side of the skyline. Additionally, a yarder running a standing skyline running a motorized carriage could reach 75' to either side of the skyline. This resulted in tail tree spacing at the back-end of the unit of 50 and 150 feet. From this it was calculated that these spacings resulted in fewer than 2 and 18 trees per acre.
With LMS the RIU polygons on the landscape can be grown out at 5 or 10-yr intervals using FVS, Forest Vegetation Simulator, as the growth model. Even though FVS has problems with volume projection the diameters it estimates through time tend to be very close to what actually occurs. Thus, the potential of QMD of available tail trees may be accurately predicted. With this tool in LMS distributions of average tail tree QMD for all RIU polygons on the landscape can be created. Examples of this can be seen in Figure 25 through Figure 28, distributions of tail tree QMD's for all stands with 50 and 150-foot tail tree spacing for 1998 and 2003. Given these examples it can be seen that the mode of the distribution increases with an increasing in the spacing of tail trees and age increases. Thus, if a stand cannot support a large enough skyline to efficiently harvest the unit the best option may be to let the unit grow a few more years or look at other equipment options to fit the potential tail tree QMD's.
From tail tree QMD's the potential rigging height may be determined from Oregon Occupational Safety and Health Administration's guidelines for maximum tail tree rigging height based on tree DBH (OR-OSHA, 1997). Given that tail trees would be rigged at 50', 30' or 2' (ground level) it can then be determined how high tail trees might be rigged based on the output from the LMS script. Figure 29 through Figure 32 are distributions of the number of stands that for each chosen average rigging height for 1998 and 2003. Caution should be use when applying these figures. They were developed for Oregon. Trees in the Hoodsport area tend to have a high amount of taper. Thus, the actual rigging heights may be lower than predicted by OR-OSHA.
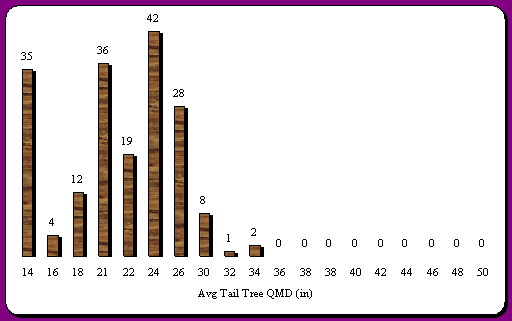
Figure 25. Distribution of estimated number of stands with 18 potential tail trees per acre (50' spacing) in 2" QMD classes for 1998
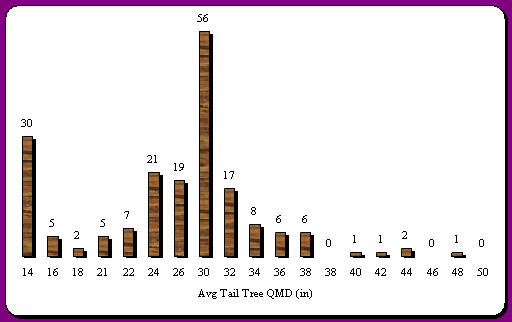
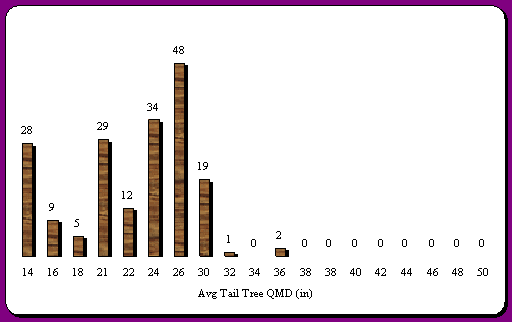
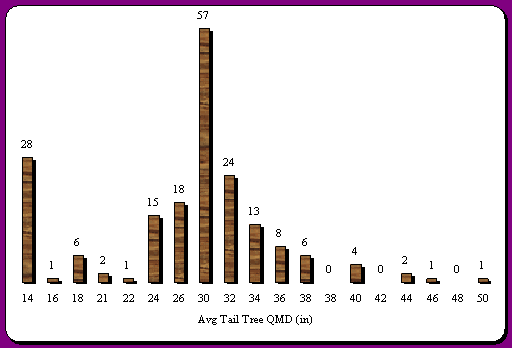
Figure 28. Distribution of estimated number of stands with 2 potential trees per acre (150' spacing) in 2" QMD classes for 2003
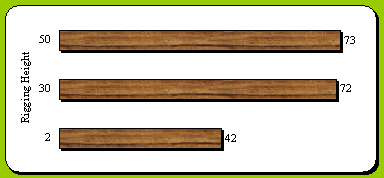
Figure 29. Number of RIU polygons on Hoodsport planning area with average tail tree rigging height of 50, 30, or 2 feet (ground level) based on 50 foot tail tree spacing for 1998
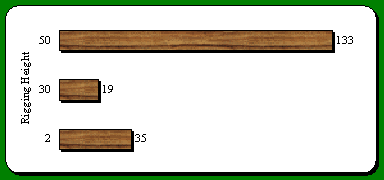
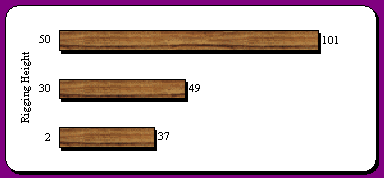
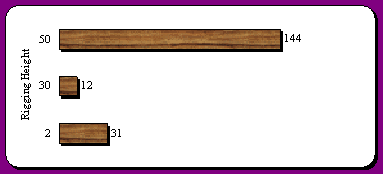
Figure 32. Number of RIU polygons on Hoodsport planning area with average tail tree rigging height of 50, 30, or 2 feet (ground level) based on 150 foot tail tree spacing for 2003
Note: The number of stands with an average rigging height of 2 feet may include stands, which have not yet reached harvestable age.
These distributions of tail tree rigging heights were used as input for PLANS. When problems were encountered with deflection the tail tree height could be entered to attempt to increase deflection. Raising the height of the tail hold also allows increased suspension to potentially fly logs over or through riparian buffers without disturbing the streambed. Analyzing potential tail trees and their location while planning harvest units can give the planner much more flexibility if the planner looks beyond the typical harvest unit boundaries (roads, draws, stream buffers) at the possibility of hanging on tail trees outside of the unit to increase log suspension.
A second input from tree data for setting design is turn weight. Estimating turn weight was done using a script for LMS, which was developed for the 1998 Forest Engineering Washougal project. This script was modified to fit the timber conditions in the Hoodsport area. Within the script the average Scribner volume for an individual tree is calculated. Then, for the case of processing the trees out in the brush it was assumed that there are 1.5 32-foot logs in the average tree, on average there are 3.5 logs/turn for short span systems and 4.5 logs/turn for long span systems and there is, on average, 12 lb./bf. A second case for whole tree harvesting and processing at the landing was run with the same assumptions except without bucking the trees into logs. These turn weights can be estimated for any or all of the RIU polygons on the Hoodsport planing area for 1998 or any 5 or 10 year interval in the future. An example of a turn weight distribution for the Hoodsport planing area for 1998 is shown in Figure 33.
The case of whole tree yarding was examined due to low turn weights caused by the small timber in the Hoodsport area. Increasing the potential turn weights allows the designer of the unit to get a better estimate of the type of yarder that may be used for the unit based on payload. This may help get a better fix on the cost of logging the unit as well. For an example of how turn weights are increased with whole tree harvesting see Figure 34.
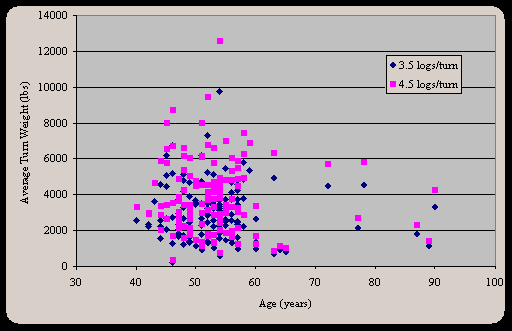
Figure 33. Distribution of average turn weights for RUI polygons from 30 - 100 years old assuming and average of 3.5 and 4.5 logs/turn
Along with this with changes in tree processing technology over the past few years it is safer and more efficient to process the smaller wood at the landing rather than out in the brush. When processing whole trees at the landing it is possible to change the dimensions of the logs on short notice when markets change and logs can be sold to different mills with different sorts on a day's notice or less. When the fallers process the logs out in the brush all the logs will be bucked for a certain set of sorts which the logger is stuck with. With a processor on the landing if sorts change the logger is only stuck with the logs sitting on the landing rather than the remainder of the logs in the unit. This will increase the potential profit by allowing the logger to sell logs to the highest paying mill.
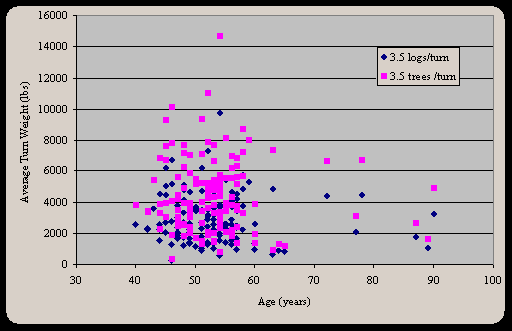
Figure 34. Distributions of average turn weights for trees harvested whole and processed in the woods assuming 3.5 logs or 3.5 trees per turn, on average.
6.2 Timber Volumes and Growth Rates
For last year's project, A Management Plan for the Washougal Landscape, LMS was used to model stand growth and yield with FVS, Forest Vegetation Simulator, as its growth model. FVS has known problems with volume calculations that give projected volumes, which may be double, or triple what one would expect to find out on the ground. Thus, for this year's project, rather than projecting stand volumes with FVS the DNR provided modeled volume data for the Hoodsport region via Weikko Jaross. This was used for calculating growth rates to be used as input into SNAP.
6.2.1 Projected Harvest VolumesTo analyze and optimize the timing of harvest of units growth rates in percent per year are needed as an input for SNAP. For stands 30 years and older Weikko Jaross calculated growth rates for the RIU polygons in the Hoodsport planning area. Plotting growth rate vs. age for two decades growth for all stands not stratified by site quality, stand density or any other criteria produces a very nice inverse-exponential shaped cluster of data points, which would be very easy to fit growth rates to.
For stands less than 30 years old hypothetical stands of Douglas-fir were planted at 400tpa and grown out to 40 years using 10 year growth periods with the young stand model SYSTUM-1, a young stand growth model developed by the US Forest Service. Stands were grown with site indexes 120, 100, 80 and 60 with no PCT or fertilizing. Tree lists were generated by SYSTUM-1 were then put into ORGANON, a growth model developed at Oregon State University, to calculate stand volumes, CVTS (cubic foot volume including top and stump) for each growth period. From these data percent annual growth rates were then calculated.
These growth rates were then combined with the growth rates for older stands for older stands to get the growth rates that were used as input for SNAP based on Site Class. Since two different models were used to calculate growth rates for the younger and older age classes caution should be used when applying the rates as if they were generated with one model. Due to differences in growth equations different growth rates may be very well be generated for the same age classes thus potentially skewing results. At age 30 where the curves from each model were quite close with the exception of less variation than in the chosen growth rates from the DNR data. Thus we felt confident that the curves could be combined in a usable fashion. Results from these data should be viewed with the aforementioned issues in mind that they could be skewed on not accurately represent growth that is actually occurring on the ground.
Oregon Occupational Safety and Health Administration (OR-OSHA). January, 1992. Oregon Administrative Rules, Chapter 437, Division 6. Forest Activities. 126p.