Scientific Writing and Graphics
Instructor: Steve Warren and Ed Waddington
Email: sgw at atmos.washington.edu; edw at uw.edu
Office: SGW -ATG 524; EDW - ATG 715
Office Hours: by arrangement
Telephone: SGW 543 7230; EDW 543 4585
Wednesdays at 4:00-5:30
Location: MGH 254.
We meet once each week for about 1.5 hours.
- Each week, all participants will read some selected articles.
- Two participants will be responsible for leading discussion of each chosen paper or chapter.
- Each week, two other participants will prepare a 1-2 page report, summarizing and highlighting the key points arising in the discussions. Before the next class, they will deliver their summary to Ed, for posting on the web site.
- Other participants will review the report, then discuss it at the start of the next class.
As scientists, we all are interested n communicating our work effectively (or at least we should be). In this seminar, we will investigate how to do that, by reading and discussing articles by authorities in the field, practicing and critiquing our own writing, and writing by others.
Topics will cover abstracts, peer-reviewed texts, proposals, and scientific figures.
Recommended preparation
Interest in creating well-written scientific papers and proposals,and producing effective scientific graphics.
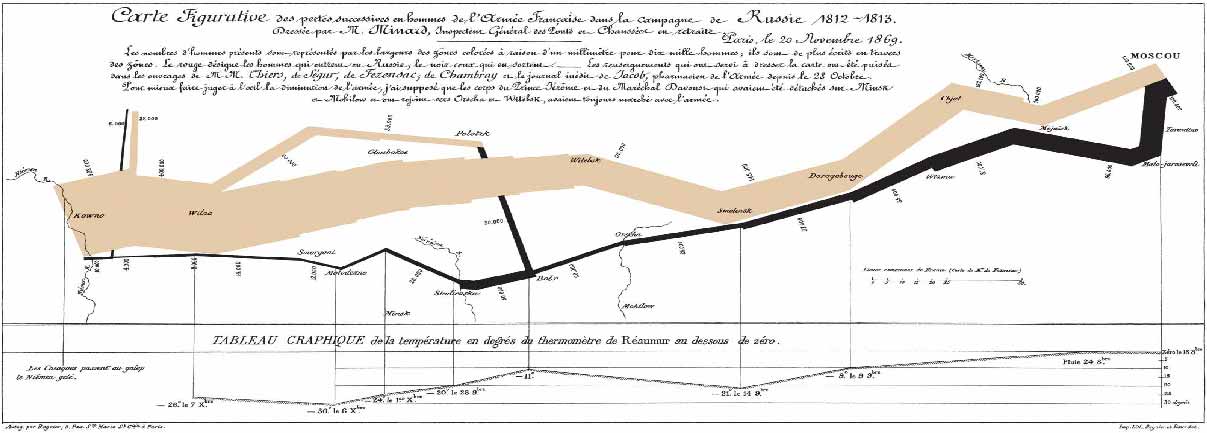
Charles Joseph Minard's famous graph showing
the decreasing size of the Grande Armée as it marches to
Last modified: 3/19/2010 5:26 PM