
| TESC 431 Home | QMH Intro | Methods | Results | Plankton | Sediments |
Data Repository:
Cross sectional data is represented from left to right with the inner harbor on the left at station 1 and the main basin being on the right at Station 5. Cross sections that only represent through station 4 were done to emphasize layering within Quartermaster Harbor.
|
Temperature profiles indicate that QMH is thermally stratified with the greatest stratification in the inner harbor and the least stratification at the mouth of the harbor. The shallow inner harbor exchanges water at a reduced rate allowing thermal energy to build up at a higher rate compared to the outer harbor.
 |
Overall temperatures decreased from station 1 in the inner harbor to station 5 in Colvos Passage outside of the harbor. Station 5 has a layer ~60 m in depth from the higher salinity, colder water from the Pacific Ocean that sinks to the bottom and resists mixing with the less dense water at the surface.
 |
Salinity is lower at the surface for all stations as expected due to freshwater inputs from Judd and Fisher Creeks into Quartermaster Harbor. Salinity is the primary factor determining density.
 |
Dissolved oxygen is above saturation in the well mixed layer near the surface due to phytoplankton activity. DO decreases below the pycnocline for all stations (1m point for station 3 in the raw CTD data was erroneous and not plotted).
Studies during 1975, 1982, and 1983 found conditions of low DO that led to placing Quartermaster Harbor on the Washington State 303d list (State listed bodies of water that fail water quality standards) in 1998 (Department of Natural Resources 2004).
Although our data indicates satisfactory levels of DO, low DO conditions may be widespread and persistent during Summer and Fall, but limited data is available to make a definite determination.
 |
Reduced dissolved oxygen levels below 8 mg/L occur at a layer ~60 m deep. The intrusion of higher salinity water creates a second pycnocline and prevents mixing of the water column.
 |
The well mixed layer, with inputs from freshwater sources has lower density due to the lower salinity content of the surface layer. The lower density layer resists mixing with the deeper layers with higher density and is a controlling factor of how well and how deep oxygen mixes into the water column. Density stratification can result in low oxygen conditions in the deep layer.
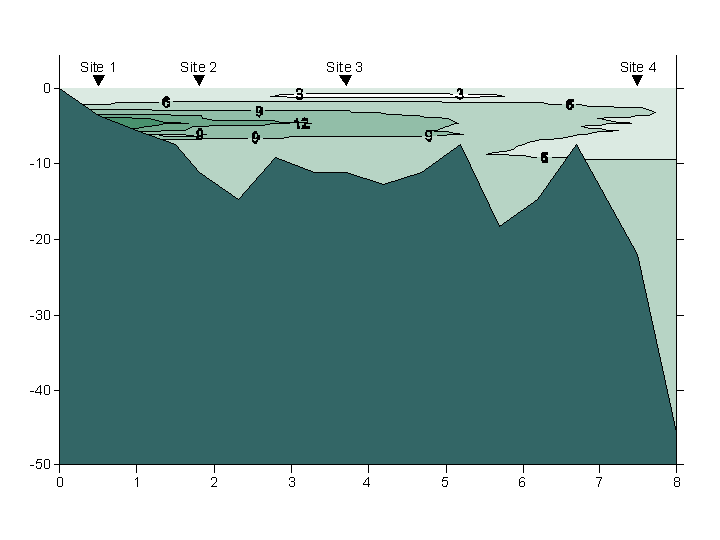 |
Fluorescence for stations 1 - 4 indicated peaks in fluorescence between 3-6 meters. This trend is due to plankton having an optimum depth below the surface reducing the amount of light they receive, because too much sunlight can be harmful.
 |
Water clarity, measured as a function of percent transmission was above ~50% for all stations at the surface and increased with increasing depth. The intrusion of main basin water has higher clarity or percent transmission than the water in the harbor. The percent transmission of light can be a limiting factor for phytoplankton productivity.
 |
 |
|||||||||||||||
|
||||||||||||||||
The Licor light meter measures light transmission in μmol. As light radiation (from the sun) passes through the water column it is absorbed by primary producers, backscattered, and turned into heat. As light transmission decreases with depth, there is less energy for photosynthetic organisms. Using the light meter, we can find the compensation depth, where plankton can no longer survive off sunlight alone. To find the compensation depth we use the formula:
Iz = Ioe-ήz
Where "z" is depth in meters, "n" is negative extinction coefficient, Io is light intensity at the surface, and Iz is solar irradiance (Wetzel 2001). We chose 99% light absorption to be our compensation depth and used data collected to just under 100 μmol of light to get our exponential line equation. At stations 1 and 3 the compensation depth was 4.8 m and 12.8 m respectively, therefore light reached the bottom at both of our sites in Quartermaster Harbor. This means that plankton could survive throughout the water column at stations 1 and 3.
Secchi depths were close to the calculated compensation depths as represented by the blue (lake) and green (ocean) lines on absorbance vs depth graphs. This is most notable for station 3 when using the ocean Secchi disk.
| TESC 431 Home | QMH Intro | Methods | Results | Plankton | Sediments |