Introduction to Geographic Information Systems in Forest Resources
| Introduction to Geographic Information Systems in Forest Resources |
|
|||||||||||||||
|
|||||||||||||||
Tabular data in a GIS share the same importance as coordinate data. The strength of a GIS lies in its ability to manage data about spatial features, in addition to the position and location of the features themselves. In fact, in a GIS such as ArcGIS, a spatial feature exists as the pairing of the coordinate and tabular data.
In addition to representing the attributes of coordinate features, tables can exist in ArcMap as objects separate from spatial features. Before the days of GIS, a large amount of data was created about spatial features, but without an explicitly locational framework. For example, the IRS keeps track of a large amount of data referenced by Social Security number and home address. Addresses are locations in a locational framework, but they do not have Cartesian coordinate values. However, using GIS software, it is possible to assign X, Y locations to addresses. Once we have an address and an X, Y location for a point, it is possible to link the taxpayer database to location by use of relational databases. Such data can be imported to a GIS and used in mapping and analysis.
Tables are used to represent spatial data as well as to analyze spatial data through simple statistics, data summaries, and as the source for graphs. Graphs help to visualize a large amount of numeric and categorical data in a way that is easy to understand.
Using ArcMap tables
Tabular data are stored on the file system in one of several file formats. In ArcMap tables, are a graphical representation of these tabular data sources. This means that ArcMap lets us view tabular data in a GUI. So in ArcMap tables have their own GUI (buttons, tools), and their own set of particular operations.
ArcMap tables can come from a variety of sources, and multiple tables can be linked or joined based on common field values.
Tables can be created from many different formats of tabular data sources. Supported file-based sources are dBase, INFO (from ArcInfo), and comma- or tab-delimited ASCII files. Tables can also be loaded from personal and SDE geodatabases, and OLEDB connections. If a file can be loaded as a table, it will be displayed with a specific icon in ArcCatalog or the Add Data dialog.
Here, a dBASE file is added to the map document as a new table.
Tables can also be created from queries on ODBC (Open Database Connectivity) databases, such as Access, Excel, Oracle, Ingres, Informix, SQL Server, and the like. Although these tables are not saved on the disk as files, a table created from an ODBC query will be opened automatically if saved with a map document. This example shows the results of a connection to an SQL (Microsoft Access) database.
Here is the database (composed of a single table):
And the many steps necessary to access the tabular data source through ODBC.
Whether the data source for a table is file based (i.e., dBase, text, or INFO), regardless of the data source, the tables have the same look and functionality. The only important difference is that only tables from dBASE or INFO sources can be edited within ArcGIS, whereas text and ODBC tables cannot be edited in ArcGIS.
A new table can be created in ArcCatalog much in the same way a new shapefile is created.
The new table will be completely empty of both fields and records.
In order to add structure (fields and record) and content (values) to the table, it needs to be added to an ArcMap document.
There are 5 field types available in tables:
Before adding a field, you need to decide what type of data the field will hold. Then you choose a data type and field name, and if necessary, the number of decimal places. When you know how the field will be defined, add it to the table using the Options > Add Field menu choice.
Fields can also be deleted from tables, if they are no longer needed or have been entered incorrectly. To add or delete fields, the table cannot be open for editing, and you must have write permission to the file storing the data. It is not possible to alter the properties of a field once it has been created, so you should think carefully about your field definitions before you create fields.
After fields have been defined, records can be added by adding values to records. After a value has been added to a record in a table, a new record will be added to the table.
New records are added with blank values for string and BLOB fields, and zero for numeric and date fields.
Selected records can also be deleted from tables. Like fields, records can only be deleted if the table is open for editing.
Note: avoid adding records to a attribute table. Doing so may corrupt your data, possibly irrevocably, because you will end up with "orphan" records, that is records in an attribute table that are not associated with shapes.
Editing values in table records
For tables that come from dBASE and INFO tables, it is possible to edit field values. Tables that derive from ASCII files and SQL queries cannot be edited.
If the table is not open for editing, select Table > Start Editing from the menu. When a table is open for editing, the field names will appear in a block, non-italicized font. Thus, you can tell at a glance if a table is in edit mode.
Use the Edit tool ![]() to select a value to
change. When you click on the cell containing the value to be changed, the value
will highlight. Type in the new value. If you attempt to type in an invalid
value (such as text strings within numeric fields), ArcMap will not allow the
change to be made.
to select a value to
change. When you click on the cell containing the value to be changed, the value
will highlight. Type in the new value. If you attempt to type in an invalid
value (such as text strings within numeric fields), ArcMap will not allow the
change to be made.
Edits will not be written to disk until the edits are saved. If you close a table that was open for editing, you will be prompted to save or discard changes. If you attempt to close the map document or ArcMap, you will also be prompted to save changes to the table.
To edit item values in bulk, it is possible to calculate the values in a field to a constant or an arithmetic expression. Expressions can include the values in other fields, constants, arithmetic operators, or Visual Basic operators.
To calculate a field, right-click on the field name , and select Calculate Values:
.
Use the Field Calculator dialog to write the expression. In this example the new field is called age_2004, and it is the result of subtracting the values from the field ESTAB_YEAR from the constant 2004.
If you include string (text) values in the calculations, you need to put quotes (") around the strings, e.g.,
[Common_name] & "(Oncorhyncus keta)"
will calculate the active field with the contents of the field Common_name and the string (Oncorhyncus keta) separated by a blank space.
Calculations work on selected sets; if you have a selection of records and you make a calculation, the calculation will only be applied to selected records. If you do not have a selection, the calculation will be applied to all records.
Queries are used to select a subset of records. Selections can be made simply to view where features are located, to find out what other attribute values may exist for a selected set, or for use in creating new shapefiles or tables composed of a subset of the original layer or table. Queries are always built using Select By Attributes.
This query is looking for records of stands which are greater than 15 years of age, and also less than 30 years of age.
Queries can either be typed into the text entry control, or they can be built by selecting and adding fields, operators, and values with the GUI controls. In either case, it is important to use the proper syntax, especially when combining expressions to make complex queries. Queries are evaluated with standard mathematical rules from left to right, but logical order of precedence must be enforced by using parentheses (which are evaluated from the inside out). These two queries are not equivalent:
( "Age_1998" > 100 and "Area" < 5000 or "Perimeter" < 2500 )
( "Age_1998" > 100 and ( "Area" < 5000 or "Perimeter" < 2500) )
Two wildcards can be used in queries:
For example, the query string
"Latin_name" = 'Onco%'
will select any records whose value for the field Latin_name starts with the characters Onco, and the query string
"Owner_fname" = '-atherine'
will select records with the Owner_fname matching either Catherine or Katherine.
If you run queries against text fields, you also need to enclose the search string with single quotes, e.g.,
"Latin_name" = 'Oncorhyncus kisutch'
will select all records where the value of the field Latin_name is Oncorhyncus kisutch.
There are more rules for making queries in ArcMap.
When a selection is made on a attribute table, the records in the table will appear highlighted in cyan. The bottom of the table window shows the number selected of the total number of records.
If many records are selected, and those records are spread about the table, it is possible to view only selected records by clicking the Selected button. This does not change the data, but simply alters the way the data are displayed.
In addition to the selected records being shown in cyan, if this is an attribute table, selected features on the layer also appear cyan. For this reason, you may want to avoid using cyan in legend color schemes if you are using yellow as the selection color, or change the default selection color.
The default selection color of cyan can be changed to any other color (select Selection > Options from the menu).
Sometimes you may have a selection that you want to change by broadening or narrowing the query criteria.
This is specified by the Method control the Select by Attributes dialog:
The Create a new selection choice will remove any selections that are active, and apply the query.
The Add to current selection choice will add records matching the query statement to the existing selected set. This usually increases the size of the selected set.
The Remove from current selection choice will remove records matching the query statement from the existing selected set. This usually increases the size of the selected set
The Select from current selection choice selects a subset of matching records from the existing selection. This usually decreases the size of the selected set.
These controls allow you to refine an existing query. If your initial query is too broad or narrow, you can alter the selection without needing to completely recreate the query.
There are other controls for for altering selected sets:
Those are, respectively, Select All, Clear Selection, and Switch Selection.
Selecting Statistics on a field generates basic descriptive statistics about the selected field. If there is any active selection, the statistics are derived only from selected records.
Here are the statistics for the Acres field, where stands of >70 years are selected.
It is also possible to look at statistics for any other numeric field for the table while the Selection Statistics dialog is open.
This operation is so easy that it seems trivial; however, sometimes the entire reason for using GIS is to get summary data of this sort.
Records in tables can be summarized in many different ways. Summarizing a table creates a new dBase file on the disk, composed of the summary of the selected records in the active table (if no records are selected, the summary will apply to all records in the input table). This output table is also known as a frequency table.
Right-click on the field name and select Summarize. The output table will contain a single record for each unique value of the active field. In this example, the field to be summarized is Soil.name.
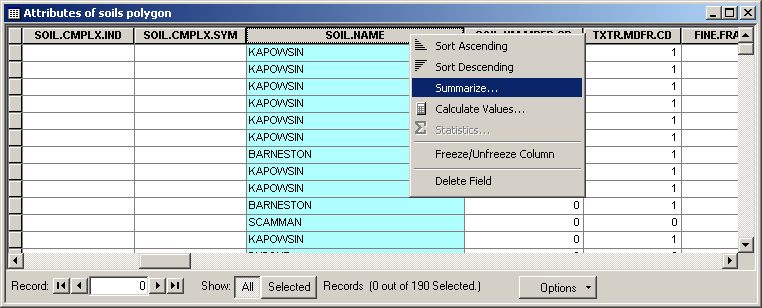
The summary statistics available are:
- Count (automatically added)
For numeric fields:
- Minimum
- Maximum
- Average
- Sum
- Standard Deviation
- Variance
For text fields
- First
- Last
The Summarize dialog is used to specify where on the disk the output file will be located, and what summary statistics are to be performed. Numerical summary statistics are performed only on numeric fields. The desired summary statistic for each field is checked. You can add as many summary statistics as you like; this will simply add more fields to the output table. When you have added all the statistics you want, click OK. The table can be added to the map document and written to disk. Following the example from above, the output table now contains only a single record for each unique soil name. Each soil name in the output table also has summary values for other attributes.
Summary tables are often linked or joined back to the tables from which they were derived.
Frequently, there is a need for the use of external (non-layer-attribute) tables in GIS map documents. A large amount of tabular data are available that have not been built specifically for spatially explicit use, but many of these datasets are able to be related to spatial data attribute tables by the use of a common field.
The classic example is a municipal parcel database. First, there may be a parcels layer which only contains the Tax Assessor parcel ID number (PIN). The Tax Assessor's office will have database tables in a typical relational database system, where ownership, address, assessed value, and other fields are indexed by the PIN. Other data may be available that are indexed by the parcel address. Other data may be indexed by owner name. All of these tables can be imported into the map document and related to each other by the PIN <-> Address <-> Ownership relationship.
Once the relationships between tables are established, cross-table queries, analysis, graph-building, and displays are possible.
There are three basic relationships among tables: one-to-one, many-to-one, and one-to-many.
In the one-to-one relationship, values of records for a single field in one table match exactly the values for the same field in another table. An example of this would be a table containing basic stand attributes, including stand name, and another table indexed by stand name, but also with more data describing each stand. These records are related on a one-to-one basis.
In the many-to-one relationship, more than one record in the source table may have a common value with only a single record in another table. An example of this is a table containing stand attributes, including a species code. The related table contains species codes as well as full species names. Because there are many stands with the same species, there are many records with duplicate species codes, whereas there are only single records for species codes and names in the related table.
The third relationship, one-to-many, occurs where a single record in the source table shares values for a field with many records in the related table. Reverse the positions of the tables in the previous example, and you will have a one-to-many relationship.
To relate tables correctly, you will need to know the content of your tables, and which relationships are valid.
A join combines the records from two or more tables into a single virtual table. The new table functions exactly like any other table in ArcMap, except that the files on the disk are not actually joined as a single file; the join only occurs within the ArcMap document. A join appends records from one table to another table, based on the values in a common field. The common field does not need to have the same name or the exact same field definition (although numeric and string fields cannot be used as common fields).
Joins can be performed on tables with a one-to-one or many-to-one relationship. Although a join can be performed on one-to-many tables, the appended record will be the first match of the common field. For one-to-many relationships, use linking instead.
In the jargon, the destination table is the table that will persist after the join. The source table is the one that will be subsumed by the destination table.
To perform a join, right-click on the table or layer in the Table of Contents and select Joins and Relates > Joins.
The Join Data dialog allows you to specify parameters of the join, which will append the records of the source table to the destination table. The values from the source table are added to the records in the destination table whose values match. Although the table appears to change, the files have not; both the destination and source tables will remain on the disk.
Here, the soils tables from the previous example for tabular summaries have been joined. You can see the new fields are appended at the end of the list of fields.
If there are no matches for values in the destination table with values in the source table, the resultant joined table will contain blanks for the appended fields.
When a map document is saved, the relationship between tables is preserved, and when the map document is opened, the join will be in place. To join more than two tables, the joins must be performed in a series of joins. To remove a join, select Joins and Relates >> Remove Join(s). You can remove individual joins or all joins.
Relates are used mainly to form relationships between tables that have a one-to-many relationship (although they can also be used for one-to-one and one-to-many relationships as well). When tables are related, the source table is not appended to the destination table, but any selection on the destination table can also select related records in the source table.
Here, the soils tables from the previous example are related using the SOIL.NAME field. If there is a selection on either table, it is possible to select records in the related table.
Records from both tables with the value of BARNESTON are selected.
Graphs are pictorial representations of tabular data. Graphs are easily understood and can communicate much more, and in a more compact format, than can tables.
In ArcMap, graphs are dynamically linked to the tables which store their data. When the source data change, those changes are automatically updated in the graph. When records are selected from the source table, the graph changes to show only selected data markers.
ArcMap provides several different styles of graphs, and gives you the tools to modify the style, legend, axes, units, and titles. Graphs can be placed in map layouts to add impact and understanding to the map.
A graph is created from the active table. If a selection of records is made, the graph will represent only those selected records. If no selection is active, the graph will represent all records.. If the selection is changed in any way, the changes will also be reflected in the graph.
To create a graph, select Tools > Graphs > Create Graph Properties dialog:
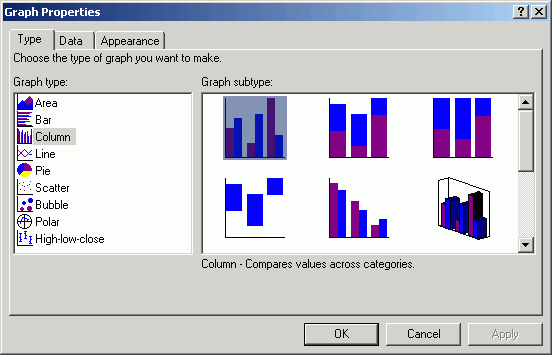
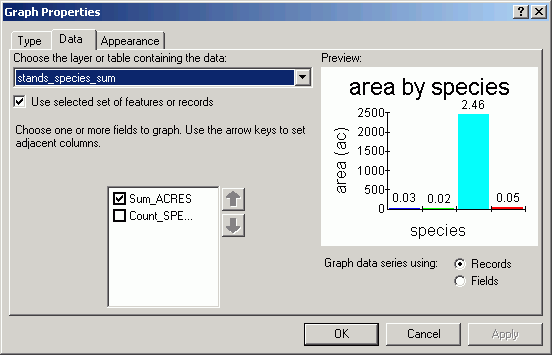
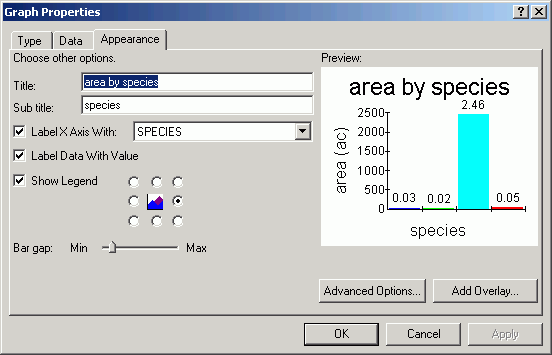
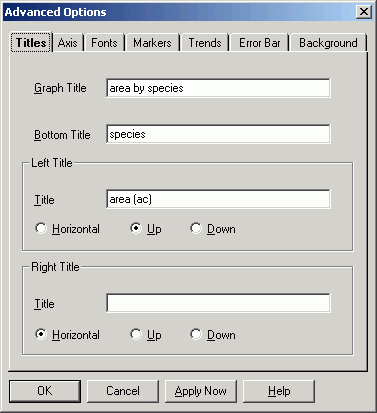
The Graph Properties dialog allows you to choose which fields to add to the graph (numeric fields only), and which field to use to label the series.
It is often customary only to graph summarized data, so in this example, a summary table was created from the stands attribute table. The summary field is species, and the summary statistic chosen is Sum_Acres. The graph is made to display one bar for each record, displaying the total acreage in each species type.
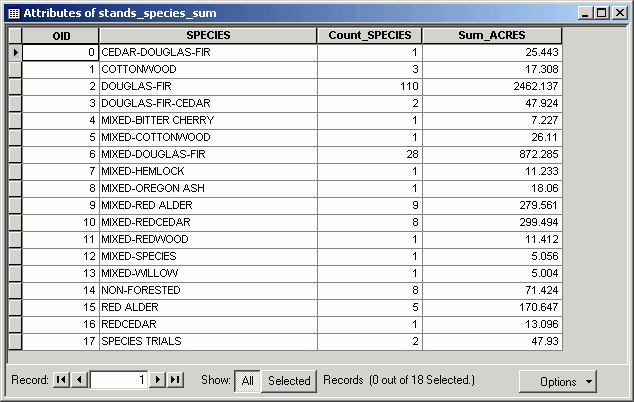
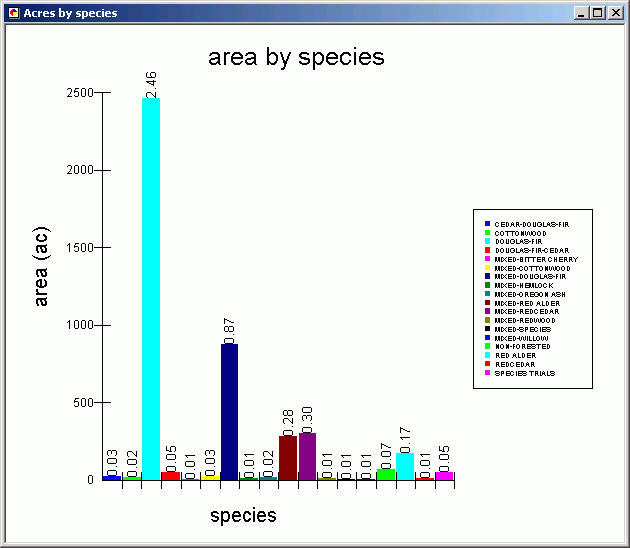
As you can see, Douglas-fir is far and away the most dominant species class, with over 2000 acres.
Graphs are composed of several elements, as indicated in the image below:
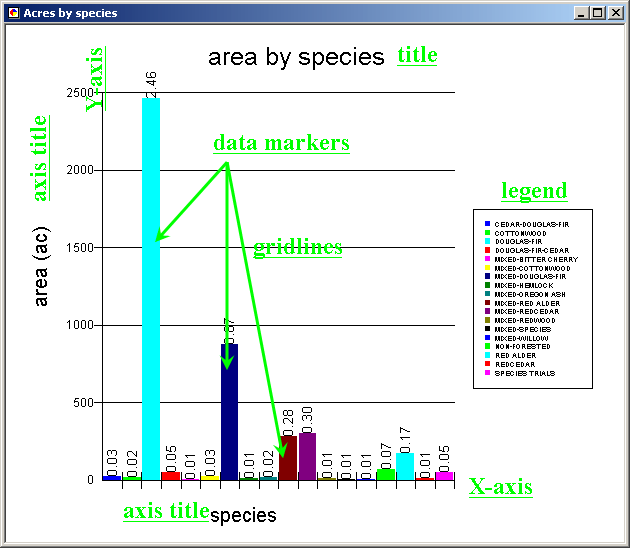
Each of these elements can be modified with the properties dialogs for each particular element.
These changes are possible:
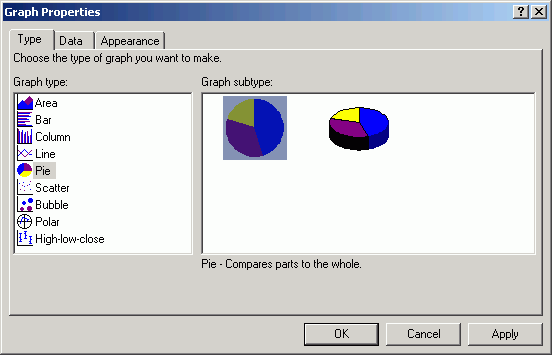
Depending on the nature of your data and what you wish to communicate, you can choose among several different graph types:
The graph legend location can be modified by a legend location.
Axis properties are automatically defined by ArcMap. However, these properties can be changed:
Axis properties are controlled by the Advanced Options within graph properties.
Return to top | Ahead to Help Topics
|
|||||||||||||||

|
The University of Washington Spatial Technology, GIS, and Remote Sensing Page is supported by the School of Forest Resources |
School of Forest Resources |