Policy decision tools
Sea level tool (opens in separate window)
Cutting across uncertainty
If we are trying to determine when a certain sea level rise
will occur, we can use the figures in
What happens? Cutting across the 90%
confidence region we get (more or less) a 90% region of years
before which this level of increase is quite unlikely, and after
which it is highly likely. We can of course not rule out the
possibility of that level occurring earlier than our lower bound
or not until after our upper bound. There is after all (at
least) 10% probability of an event in the tails of the
distribution. Also, we do not know which scenario will play out
in reality. But the following figure and table gives guidelines
that can be quite useful for the decision making. They are
computed relative to the average 1970-1999 sea level.
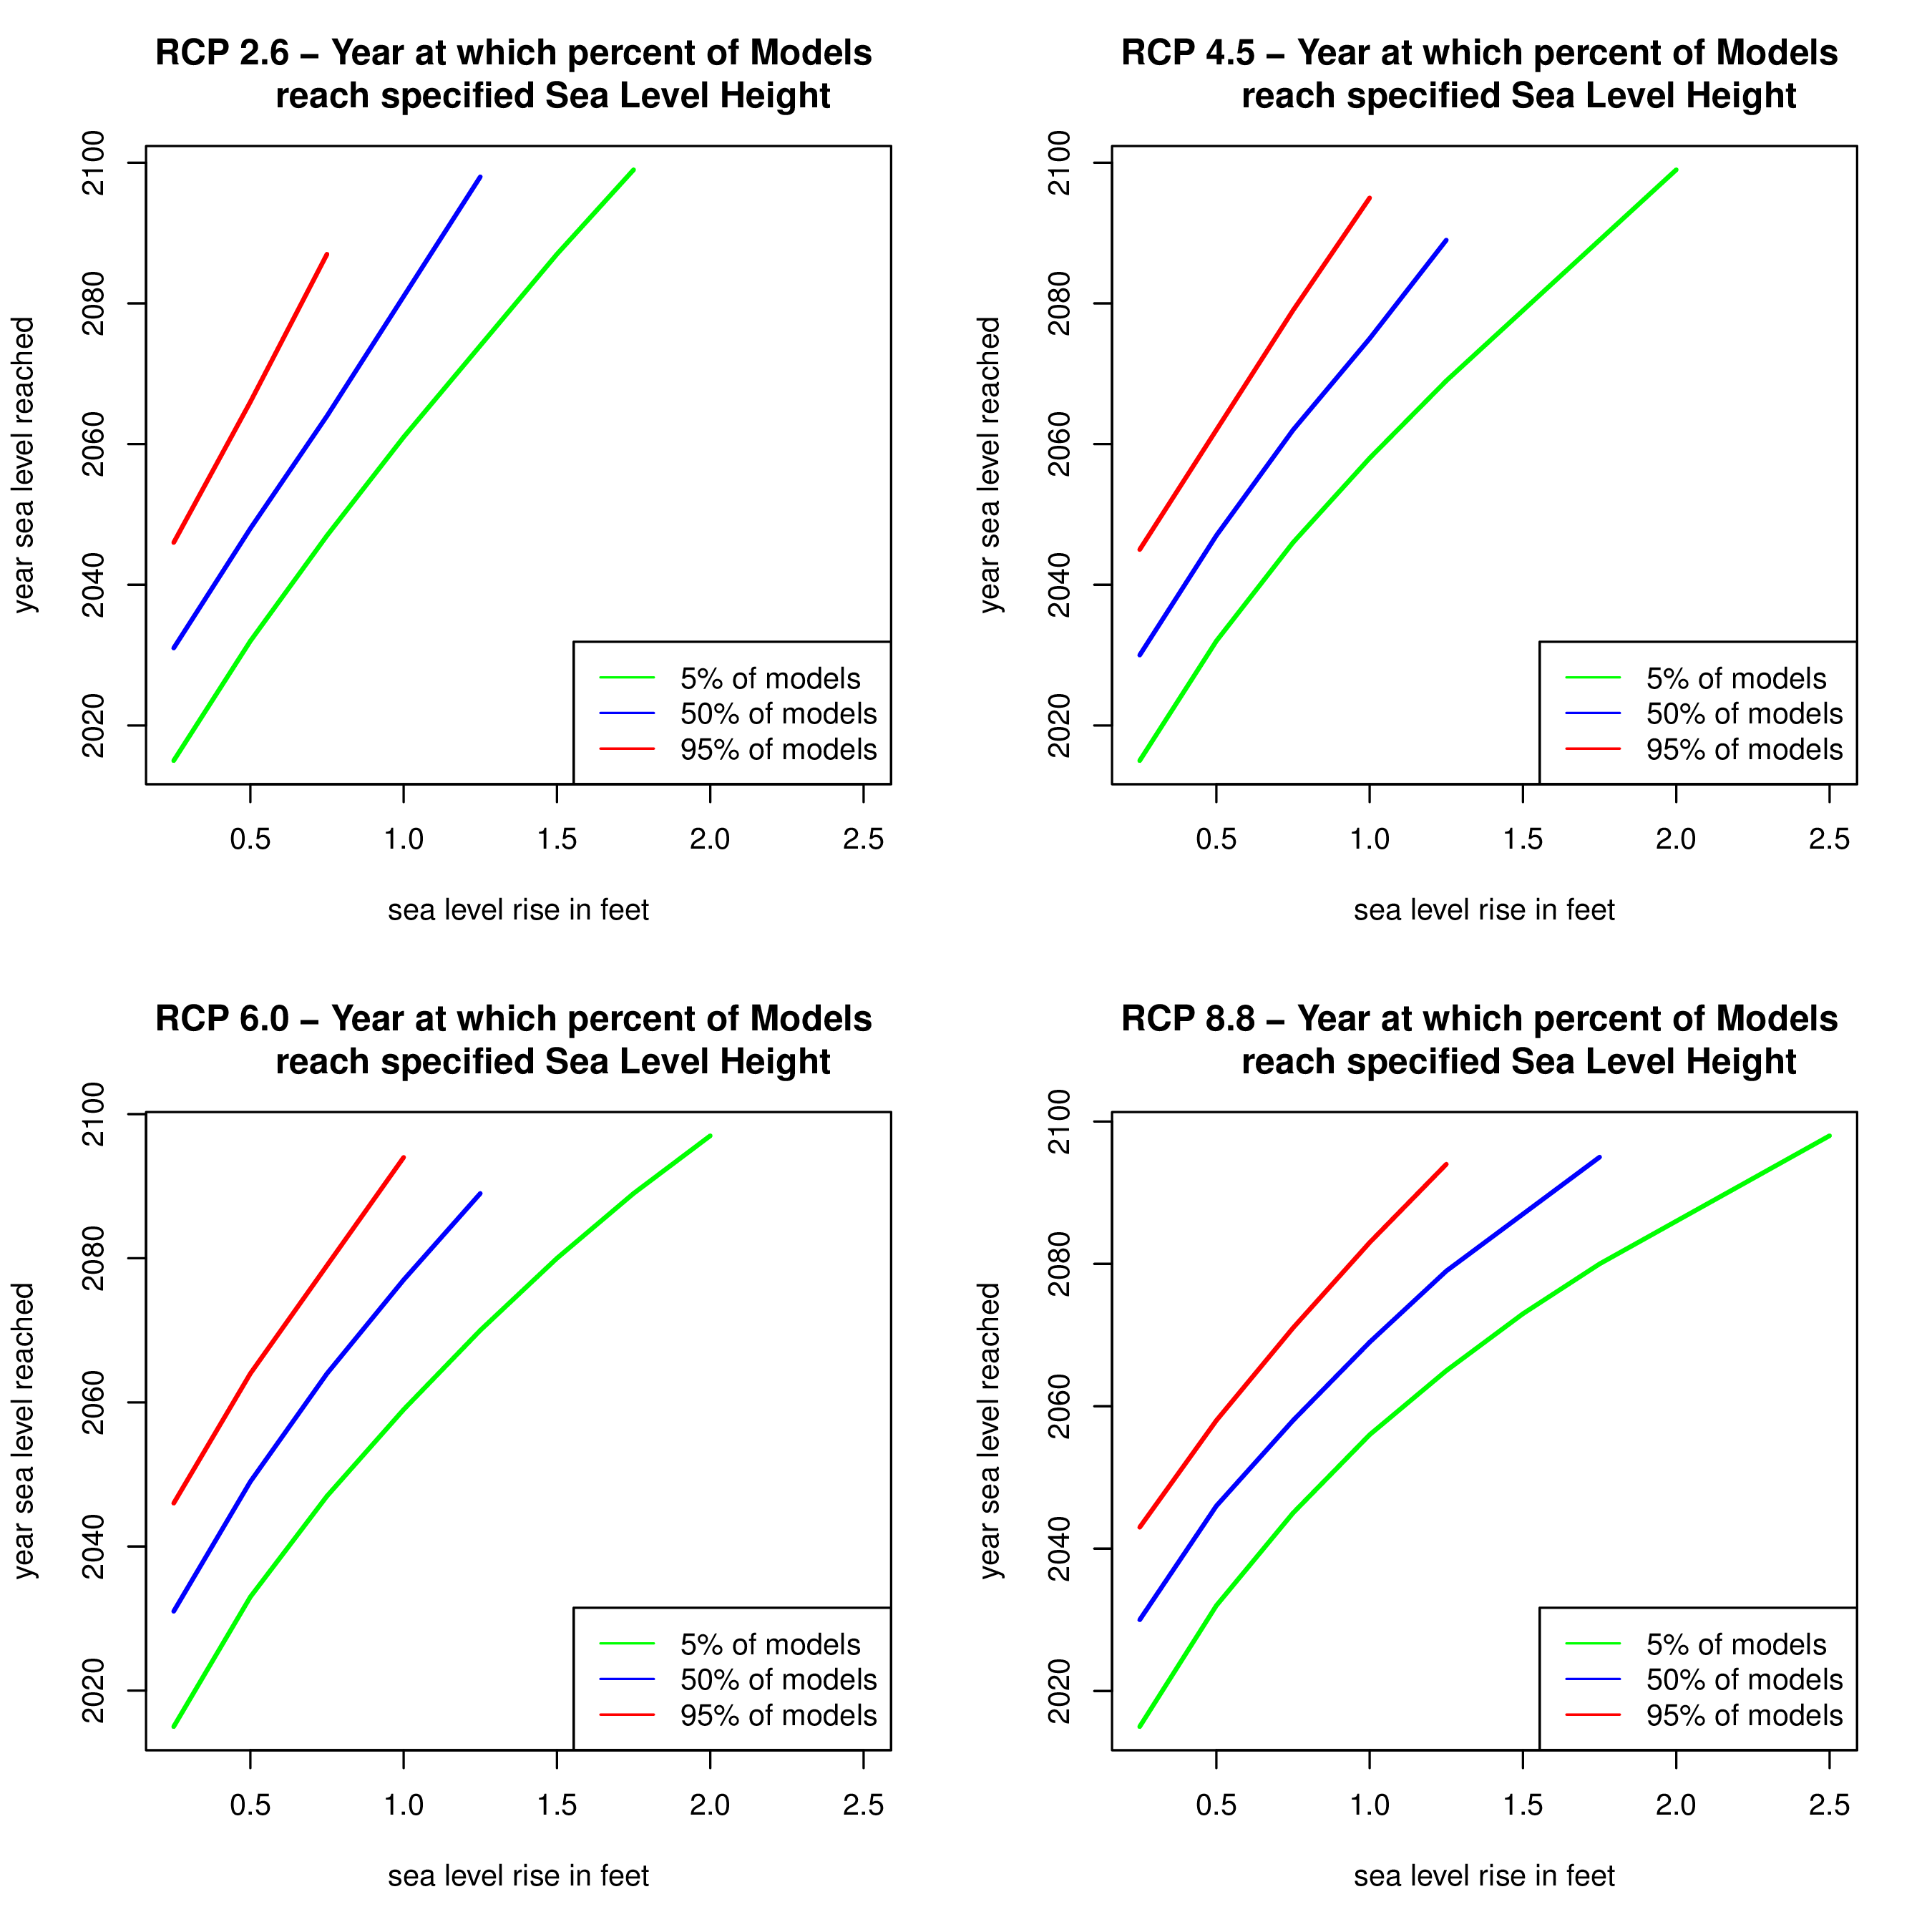
Scenario 1 (RCP 2.6)
| Sea Level (Ft) | Min Year | Median Year | Max Year |
|---|---|---|---|
| .25 | 2015 | 2031 | 2046 |
| .5 | 2032 | 2048 | 2066 |
| 1 | 2061 | 2081 | After 2100 |
| 2 | After 2100 |
After 2100 | After 2100 |
Scenario 2 (RCP 4.5)
| Sea Level (Ft) | Min Year | Median Year | Max Year | ||
|---|---|---|---|---|---|
| .25 | 2015 | 2030 | 2045 | ||
| .5 | 2032 | 2047 | 2062 | ||
| 1 | 2058 | 2075 | 2095 | ||
| 2 | 2099 |
|
|
Scenario 3 (RCP 6.0)
| Sea Level (Ft) | Min Year | Median Year | Max Year | ||
|---|---|---|---|---|---|
| .25 | 2015 | 2031 | 2046 | ||
| .5 | 2033 | 2049 | 2064 | ||
| 1 | 2059 | 2077 | 2094 | ||
| 2 | 2097 |
|
|
Scenario 4 (RCP 8.5)
| Sea Level (Ft)) | Min Year | Median Year | Max Year |
|---|---|---|---|
| .25 | 2015 | 2030 | 2043 |
| .5 | 2032 | 2046 | 2058 |
| 1 | 2056 | 2069 | 2083 |
| 2 | 2086 | After 2100 | After 2100 |
The cost of not deciding
When thinking about how to deal with the possibility of sea level rise, there are consequences of postponing decisions, or not making them at all. While many of the policy options for dealing with sea level rise are extremely expensive upfront, the costs of doing nothing are not zero and could potentially be even greater than the cost of protections. Not deciding assigns an implicit value for how much you are willing to pay in cleanup costs if sea level does indeed rise and causes damage to the city. When thinking about the damage costs, the city must consider the immediate cost of cleanup after flood waters have receded, as well as costs associated with public and private property and infrastructure damage and environmental harm that are more long-lasting. An increase in sea level rise would also mean an increase in frequency of flooding events, so the city could incur these costs over and over.
The
following example uses estimates from the City of Olympia’s Engineered
Response to Sea Level Rise Technical
Report in 2011. There are estimates for the city to begin
building a number of protective options that guard against a
1ft sea level rise, as seen in Policy Options(requires link), as early as sea level rises
0.25ft and 0.5ft in various locations. We chose to look at the
probability that sea level rise is below 0.5ft, above 1ft, and
in between for the years 2025, 2050, and 2075. Additionally,
the Technical Report has conceptual cost estimates for these
protective options against a 1ft rise in sea level. These
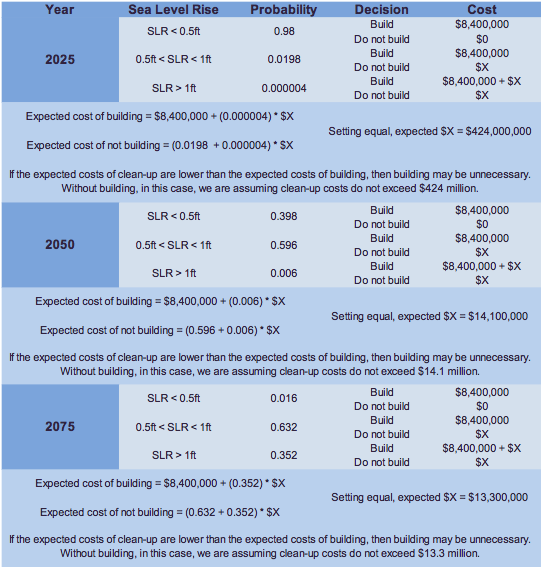
estimates will be used in our example (pg.53)
Assume
that
a portfolio of protective options for guarding the coastline
against a sea level rise of 1ft or less costs $8,400,000 and
the clean-up cost for a flooding event is $X. The table below
illustrates the value of the probabilities for varying heights
of sea level rise regarding an example of the expected costs
of deciding to build protective options or not. The (very
simplified) assumption is that sea level rise under half a
foot is not causing damage. Calculations are approximate and
in current dollars. The probabilities are computed relative to
the 2010 sea level in Olympia as was done in the 2011
Technical Report. In 2025 it is very likely that sea level
will not rise more than half a foot, and the implied cleanup
value of not building is therefore quite high. By 2050 it has
become fairly likely of having a sea level rise of more than
half a foot, but still not likely to go over a foot, while in
2075 we project substantial probability of sea level rise over
a foot, with values less than half a foot are very unlikely.
Contact: peter (at) stat.washington.edu