Results and Discussion
[Main] [Introduction] [Sampling Locations] [Methods] [Results/Discussion] [Data Repository]
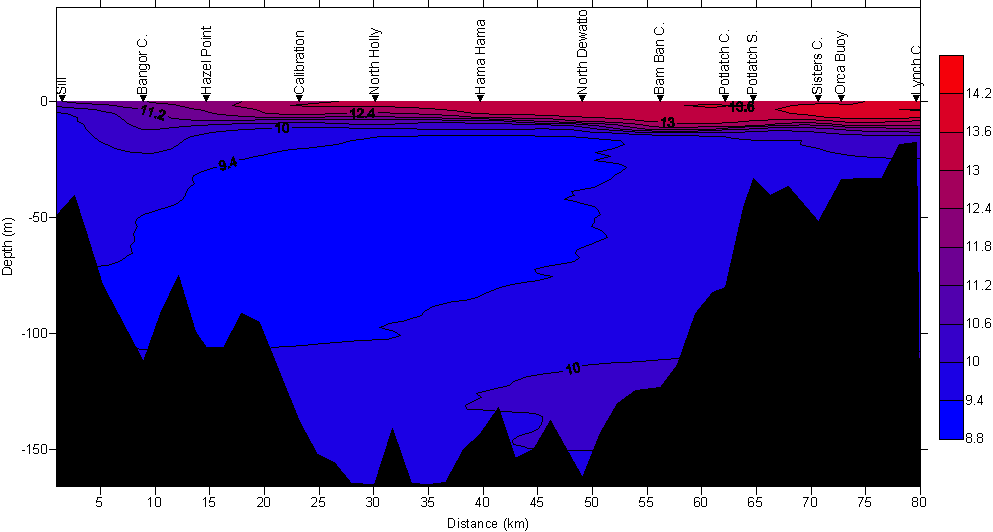
Temperature:
Temperature measurements are consistent throughout the water column for most sampling sites ranging from 9°C-14°C. Temperature measurements were warmer at the surface to about 15 -20 meters. At 20 meters, the temperature profile declined to its lowest point and remained consistent with minimal change throughout the remainder of the water column. The thermocline ranges from 10-20 meters in depth and remains at approximately 10°C below 20 meters. This stratification is related to the narrow, deep characteristics of the canal and poor circulation.
Salinity and Density:
Salinity is the dominant factor in determining the density of sea water in estuarine systems. Thus, the profiles for salinity and density are similar. Both profiles suggest the degree of salinity and density increase with depth. The halocline is between 10-20 meters. This indicates that the surface is comprised of less dense freshwater. The combination of salt water with the colder deep waters causes the density to increase with increasing depth. The temperature, salinity and density profiles indicate stratification in the Hood Canal.
Salinity
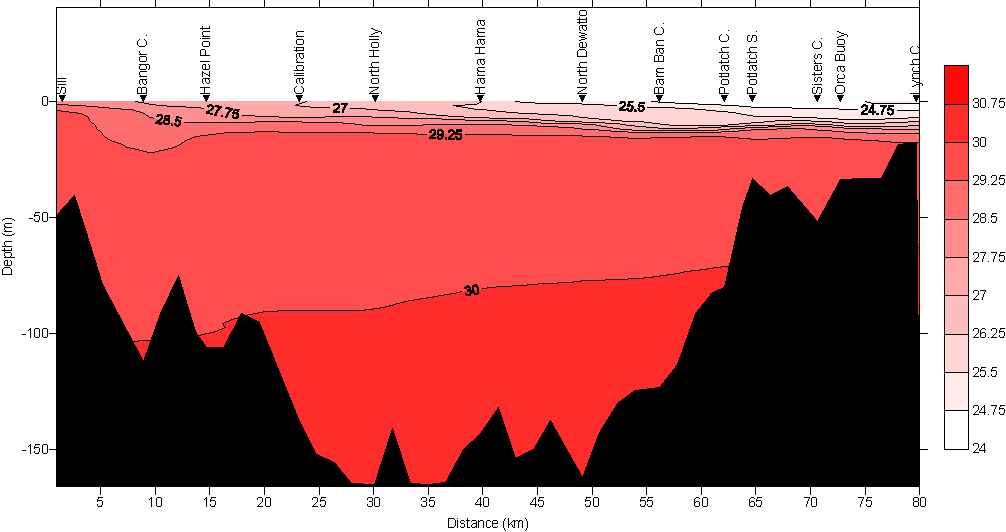
Density

Dissolved Oxygen:
In general, dissolved oxygen concentrations decrease with increases in depth. A hypoxic zone is defined as oxygen concentrations below 4 ml/l. Station 25 ( ORCA Buoy) had the lowest dissolved oxygen reading at 1.0 ml/l at approximately 30 meters in depth. Sample stations 18, 20 and 23 were below 2 ml/l at 30 meters in depth. Sample station 13 was below 2 ml/l at 15 meters. Sample stations 7, 9 and 11 became hypoxic at the 50 meter mark. The stations closer to the sill presented higher dissolved oxygen concentrations possibly due to the water being better mixed. As expected, dissolved oxygen readings decreased further into the canal with some of the lowest readings occurring from the Great Bend to Lynch Cove. The flushing ability also diminished as you proceed further into the canal, which is reflected in the dissolved oxygen readings. The CTD data is compared to manually gathered dissolved oxygen measurements. The regresssion line showed an average correlation between the manual versus the CTD measurement for dissolved oxygen.


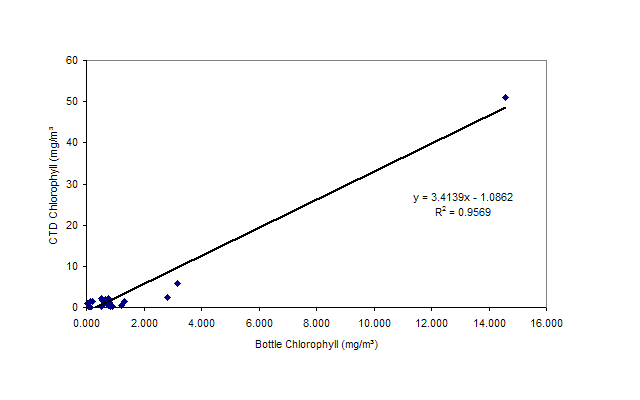
Chlorophyll:
The fluorometer data indicated that shallower waters tend to contain more organisms that fluoresce, as well as have the greatest change in fluorescence from shallow to medium depths. The optimum range for primary production is between 10-20 meters in depth. Fluorescence measurements showed the stations closer to the sill as having lower concentrations of chlorophyll. This may be the result of more mixing occurring near the sill due to influences from outside the canal. Stations 20, 23 and 25 had the highest degree of fluorescence at approximately 135 mg/mł. The fluorescence values were signficantly higher than those obtained approximately this same time last year. The higher fluorescence at these sample stations suggests that phytoplankton activity may be occurring at a rate that is more prone to developing algal blooms during certain times of the year, as well as having some of the lowest dissolved oxygen readings. As the distance increased from the sill, the water was able to settle allowing for higher primary productivity to occur. The bathymetry and poor circulation within the canal allows the nutrients to settle and remain for longer periods of time, particularly in the southern portions of the canal. Profile is adjusted for depth representing the top 20 meters of the water column. This was done to provide a more accurate representation. Chlorophyll is concentrated at the surface depths rather than deeper depths where there is minimal sunlight penetration. For data comparsion and verification, the manual measurement of fluorescence was compared to the CTD measurement. The regression line shows the manual versus CTD measurements for fluorescence as having a high degree of congruence. However, the line of fit is not an accurate representation. Several of the fluorescence samples were recorded as over the limit, therefore are not represented on the graph. There is not an adequate number of data points for calibration purposes.

Secchi Disc:
The Secchi data showed light penetration to be between four and nine meters at most of the stations sampled. Light penetration was below four meters at sample stations one and three, both of which are near the sill. This data correlates with the Licor readings in which stations one and three had less clarity or lower light penetration. Station one may have low light penetration capability due to the high phytoplankton density that occurs in the area near the sill. Secchi depth measurements tended to be high in the Hood Canal because the water is more settled. The limited circulation prevents mixing/movement of particles in the water, therefore the water has greater clarity. Secchi depth measurements tended to be higher as the distance from the sill increased, and the influence from physical water movements near the waterways outside the Hood Canal diminished.

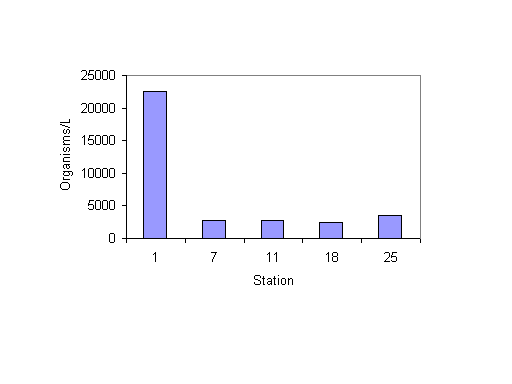
Plankton:
Chain diatoms were the predominant phytoplankton at the stations sampled. Phytoplankton density numbers showed station one to have the highest population density followed by station twenty-five. These results were consistent with last years data suggesting high phytoplankton activity occurs at the sill. Diatoms are generally found in nutrient rich waters. The large number of diatoms, particularly at station one (the sill) suggests that the waters are fairly well mixed in this area. It would appear that with the high number of phytoplankton the sill would be able to support a larger number of consumers. The influx of fresh seawater and nutrients that enter the canal from the north may contribute to a much healthier environment than that of the southern stagnant portion of the canal.
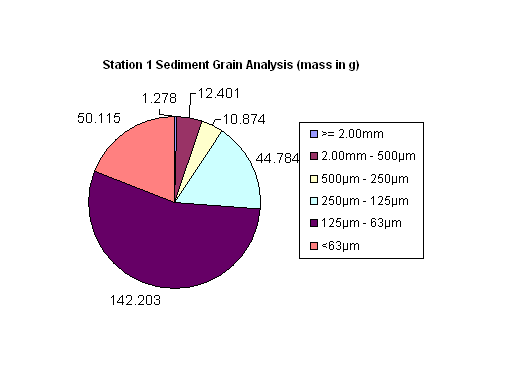
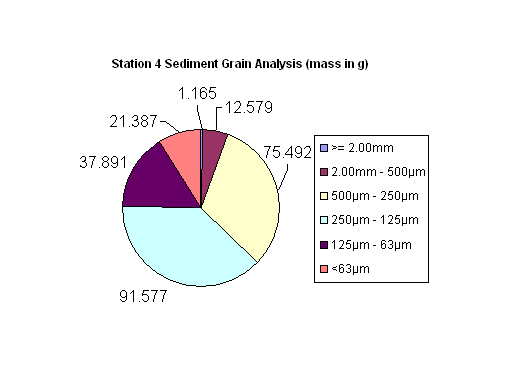
Sediment Samples:
Station 1 had the greatest number of sediment grains in the medium range of 500-125 µm. This may be the result of more active waters in the region stirring up smaller particles and circulating them to other areas within or outside of the canal. The sediment data shows the smaller size sediment particles (.063 mm to 0.250 mm) to be the most prevalent size at the other two stations sampled (3 and 4). Finer sediments tend to be deposited in low energy environments, offshore away from currents in quiet bays and estuaries.

Conclusion
The overall health of the Hood Canal regarding dissolved oxygen concentrations has become a growing concern over the last several decades. As previously mentioned, low dissolved oxygen concentrations (commonly defined as 0.5-3.0 mg/L with an upper limit of 5 mg/L) have been recorded as early as the 1950's, and at that time were primarily confined to the Lynch Cove area. Lynch Cove and the Southern Hood Canal have a naturally high primary production of organic material due to water column stability; nutrient supply input from the Skokomish/Tahuya Rivers and limited mixing. As a result, this part of the canal has historically been more susceptible to low dissolved oxygen readings. This area continues to register some of the lowest dissolved oxygen concentrations with the Orca Buoy providing the lowest level out of all stations sampled during this study. Data collected by the Washington State Department of Ecology and the Puget Sound Ambient Monitoring Program has shown a spreading seaward of low dissolved oxygen concentrations with occurrences as far as the Lower Hood Canal and North Hood Canal. The spreading of low dissolved oxygen concentrations beyond the southern portion of the Hood Canal is congruent with data gathered during this field analysis. In comparison to last years 2005 TESC 431 data, the dissolved oxygen readings obtained one year later at approximately the same time of year showed lower dissolved oxygen readings at depth and were more widespread. These agencies have been monitoring and collecting data such as dissolved oxygen as well as temperature, salinity, and fluorescence profiles since 1991. Test station locations include North Hood Canal (near Bangor), Central Hood Canal (near Hamma Hamma), Lower Hood Canal (near Sisters Point) and Lynch Cove (Dept. of Ecology 2002).
Another factor influencing dissolved oxygen concentrations is the depth of the canal, its long and narrow shape, and J-like formation. These bathymetric features contribute to the overall poor circulation and do not allow water within the canal to exchange or flush quickly. The flushing ability diminishes as you proceed further into the canal, and is more pronounced in the southern part which is reflected in the dissolved oxygen readings with some of the lower levels occurring between the Great Bend to Lynch Cove.
Stratification, the horizontal layering of water masses due to density differences, also influences dissolved oxygen concentrations. Water density is affected by both temperature and salinity. Density was observed to increase with decreases in temperature and increases in salinity. The temperature, density and salinity profiles obtained during this field study were consistent with those profiles obtained in 2005. Most of the Hood Canal is considered to have a strong and persistent stratification pattern. This stratification pattern was evident at most of the stations sampled, and appeared to correlate with dissolved oxygen levels. The stations in the Bangor area are characterized as experiencing strong-intermittent stratification suggesting that vertical mixing is more common most likely due to proximity to the sill. As a result, this area would be expected to have higher dissolved oxygen concentrations in comparison to stations located further within the canal. However, this area is not protected from low dissolved oxygen values as evidenced by near hypoxic values in 1998 and a higher frequency of <5 mg/L occurring over the last several years as recorded by the Dept. of Ecology at the North Hood Canal monitoring site (Dept. of Ecology 2002). Hamma Hamma is also considered to be in the northern region of the Hood Canal registers similar dissolved oxygen readings. During this field study sample station 9, which is Hamma Hamma, was congruent with this data showing < 5 mg/L at approximately 40 meters depth measured with the CTD.
Works Cited
Carpenter, J.H. 1966. New measurements of oxygen solubility in pure and natural waters. Limnology and Oceanography 11: 264-277.
Fagergren, D. 2004. Troubling Times for Hood Canal's Waters. http://www.djc.com/news/en/11159538.html
Hood Canal Dissolved Oxygen Program. 2005. http://www.hoodcanal.washington.edu
Puget Sound Regional Synthesis Model. November 8, 2005. Hood Canal Hillshaded Topography and Bathymetry. www.prism.washington.edu
Stout, H.A., R.G. Gustafson, W.H. Lenarz, B.B.,McCain, D.M. VanDoornik, T.L. Builder, and R.D.Methot. 2001. Status review of Pacific Herring in Puget Sound, Washington. U.S. Dept. Commer.,NOAA Tech. Memo. NMFS-NWFSC- p. 45, 175. http://www.nwfsc.noaa.gov/publications/techmemos/tm45/background.htm
Strickland, J.D.H. and T.R. Parsons. 1972. A Practical Handbook of Seawater Analysis. Fisheries Research Board of Canada.
Washington State Department of Ecology. December 2002. Washington State Marine Water Quality, 1998 through 2000. http://www.ecy.wa.gov/pubs/0203056.pdf
[Main] [Introduction] [Sampling Locations] [Methods] [Results/Discussion] [Data Repository]