San Juan Islands

Results and Discussion


[ Main ] [ Introduction ] [ Methods ] [ Results/Discussion ] [ Data Repository ]


Temperature

Figure 1.
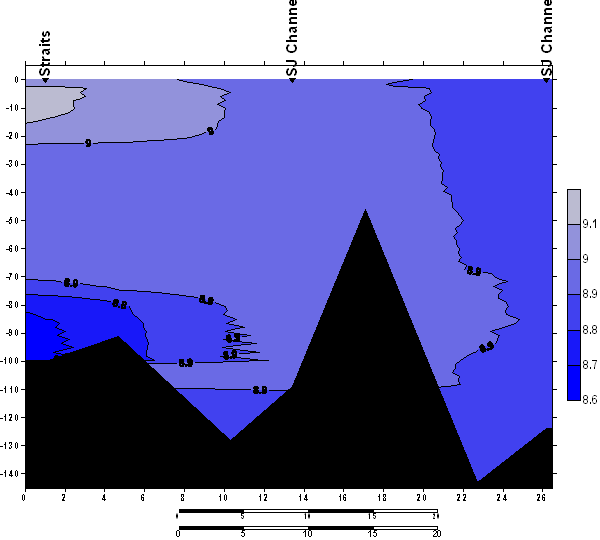
The water temperature was found to be greatest at the surface of the Strait of Juan de Fuca. The Strait of Juan de Fuca had a thermocline and was stratified. As the station locations moved north, up the San Juan Channel, the seawater became increasingly cooler. The stations within the San Juan Channel did not display temperature related stratification. This was believed to be due to the presence of heavy mixing influenced by strong currents.


Salinity and Density

Salinity and density are directly related within estuarine systems. As salinity increases in a body of water with greater presence of dissolved salts, density also increases due to the increase in mass. The Strait of Juan de Fuca station showed a great amount of stratification. This is due to the dense, highly saline, seawater from the Pacific Ocean mixing with the less salty water leaving the Puget Sound. The strong fresh water signal in the north end of the San Juan Channel is attributed to the remnant of the Fraser River outflow. The differences in density produce stratification in levels of salinity and density. This correlation is visually displayed in the figures below.

Salinity

Figure 2.
Of the three stations sampled, salinity was greatest at the Strait of Juan de Fuca which displayed a high level of stratification. Salinity was greatest at depths near the sea floor and lower near the surface. As the station locations moved north, up the San Juan Channel, overall salinity and presence of the halocline decreased. Currents traveling through the channel work to mix the salty ocean water entering through the southern opening of the channel with the less salty water entering from the northern entrance.


Density

Figure 3.
Density data showed nearly the exact same characteristics as the data collected for salinity. Density was greatest at depths between 75m and 100m in the Strait of Juan de Fuca and decreased while approaching the surface. As the station locations occurred north, up the San Juan Channel, levels of density and stratification decreased significantly.


Subsurface Oxygen

Figure 4.
Subsurface dissolved oxygen levels were found to be greatest in the Strait of Juan de Fuca. Following the same trend as seen with temperature, salinity and density data, the Straits showed a great level of stratification, while the San Juan Channel displayed a higher levels of water mixing. In the Straits, water near the surface had the most dissolved oxygen compared to the other stations sampled. Alternately, the deep Pacific Ocean water had the lowest amount of oxygen present.


Chlorophyll Content

Figure 5.
A sub-surface chlorophyll max was seen at depths between 10-20 meters at the Strait of Juan de Fuca in the area of strong stratification. Within the San Juan Channel chlorophyll levels were evenly distributed throughout the water column do to increased water mixing.


Comparison of Methods

Comparing data from the CTD to data obtained by chemical analysis in the lab can be useful in determining if the instruments are properly tuned. This comparison can also display possible anomalous data points that may have been caused by human error. The different methods are plotted against each other, and the quality of the data can be observed by analyzing the best fit line of the data.

The equations for the best fit lines of the data are recorded on the plots. The R2 value represents the precision of the data compared to the best fit line. An R2 value that approaches 1 shows that the data points fit the line well and indicates that the two different methods were in agreement.


Figure 6.
Comparison of chlorophyll data collection methods returned a R2 value of 0.7307. This indicates a moderate level of data collection precision.


Figure 7.
Comparison of chlorophyll data collection methods returned a R2 value of 0.982. This indicates a high level of data collection precision.


Secchi Disk

Figure 5.
The Secchi Disk data showed that surface visibility was greatest at the north opening of the San Juan Channel (Station 5), and least at the Strait of Juan de Fuca (Station 1).


Plankton

The plankton count showed a significance difference in the number and type of plankton at stations 1 and 5.  Station 1 was located where the Pacific Ocean water met the fresher water of Puget Sound, and had the greatest abundance of overall plankton including high concentrations of: centric diatoms and chaetoceros phytoplankton, and copepod zooplankton. Station 5 had a greater abundance of other plankton possibly due to more nutrients available through mixing.


Van Veen Grab Sample

Sediment collected in the first grab sample at a depth of 133m showed a sandy bottom with shells and a worm.  A second grab sample was collected at 126m, (change in depth due to drift with current,) revealing a hard sandy bottom with clay, mussel and scallop shells, and a tube worm.


[ Top ] [ Methods ] [ Results/Discussion ] [ Data Repository ]

[ Main ]

Web page created by Alexander Abrahamson and Mary Goreczny