|
|
San Juan Islands Methods |
Based on the physical characteristics of any body of water, different methods of data collection are required. Since the methods of data collection are often the same from site to site, we have included a general methods page, that provides a description of all methods used in our study. Listed below are the methods that were used specifically at the San Juan Island stations.
|
|
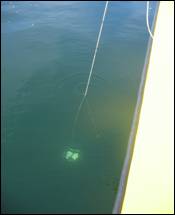
Light attenuation in the surface water was measured at each station using a 30 cm Secchi disk. The disk was lowered on a weighted line and depth was recorded when it disappeared from view.

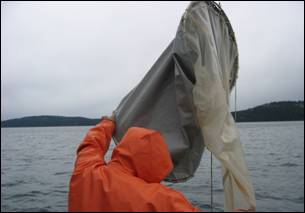
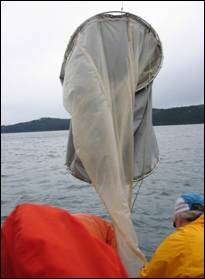
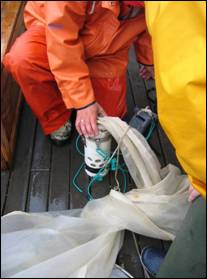
A 153 micron mesh plankton closing net was used to sample from 100 meters depth to the surface, collecting 38.43 cubic meters volume; however, the closing net did not close at 50 meters when tripped. Also used at Station #1 was a horizontal plankton tow with a 24 micron net. No plankton collection was conducted at Station #4. Plankton collection was conducted at Station #5 using a closing net 153 microns, sampling from125m to 75m. The volume sampled was 19.24 cubic meters.
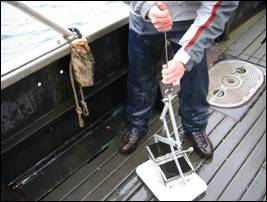
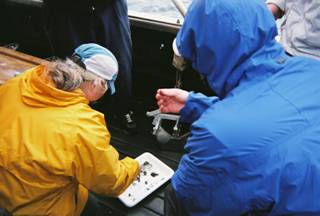
The Van Veen grab sampler was used to collect samples of bottom sediment from Station #5 in San Juan Channel, west of Wasp Island and North Pass. Due to the minimal amount of sediment collected in the first grab sample at a depth of 133m , a second grab sample was collected at 126m.

[ Introduction ] [ Methods ] [ Results/Discussion ] [ Data Repository ]
[ Main ]
Web page created by Alexander Abrahamson and Mary Goreczny