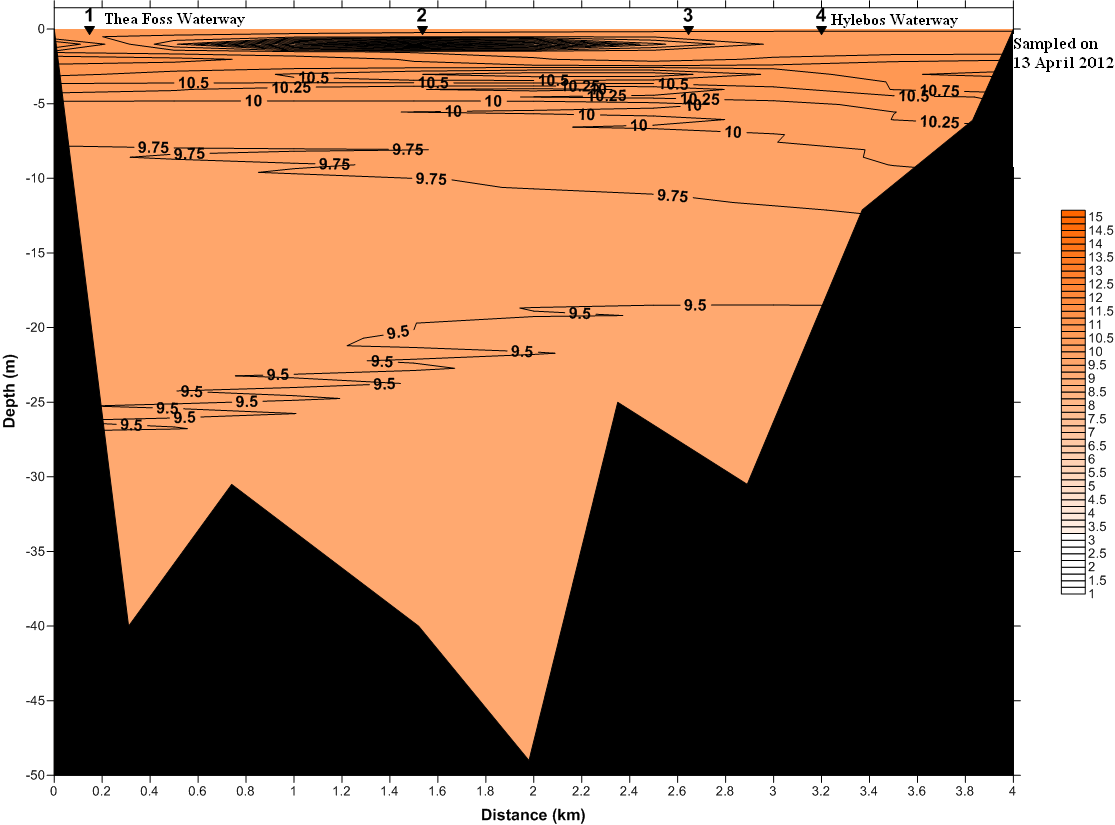
| Sampled on 13 April 2012 |
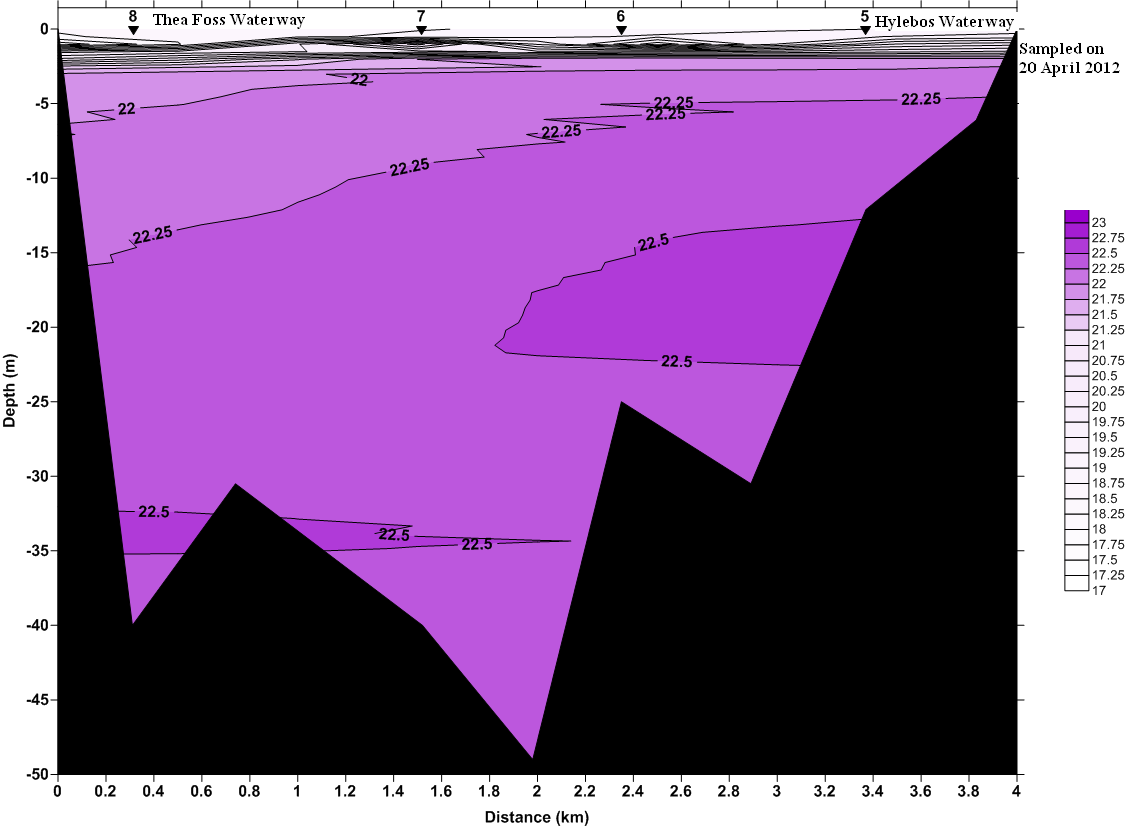
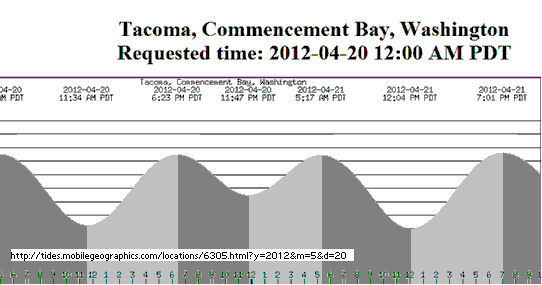
Sampled on 20 April 2012 |
 |
 |
| Sampled on 13 April 2012 |
 |
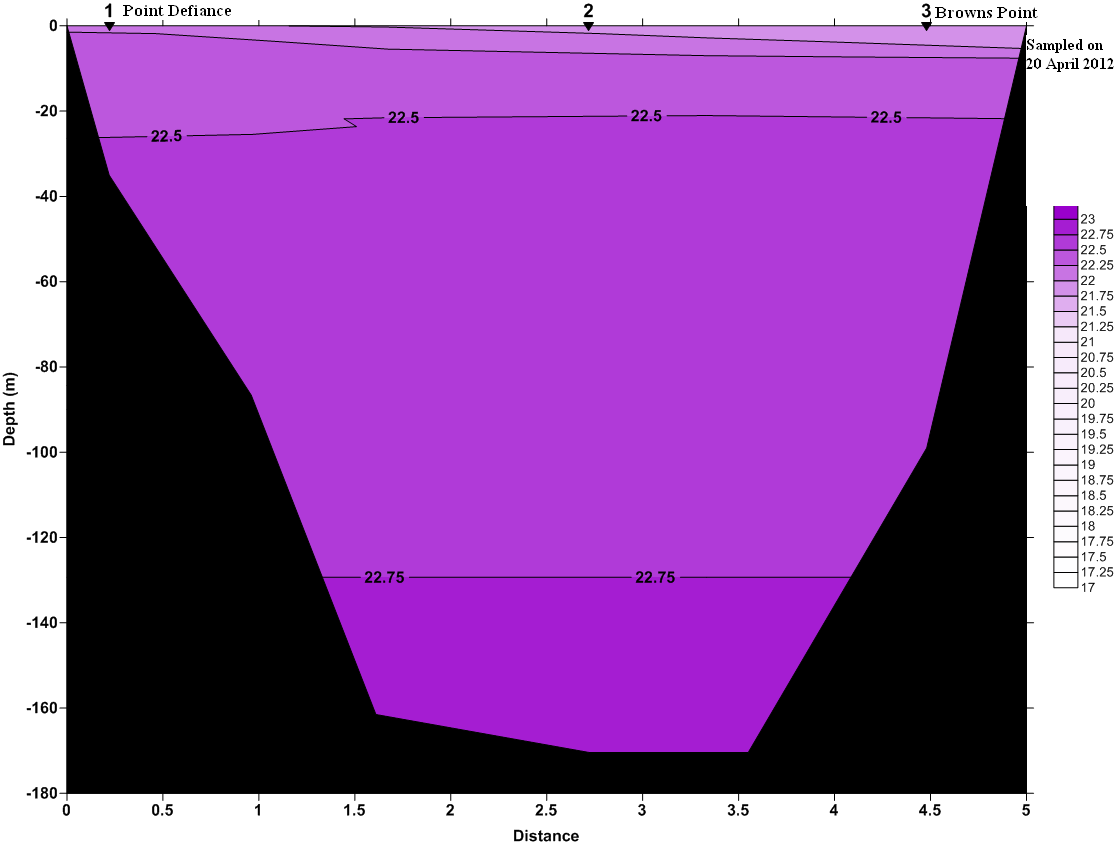
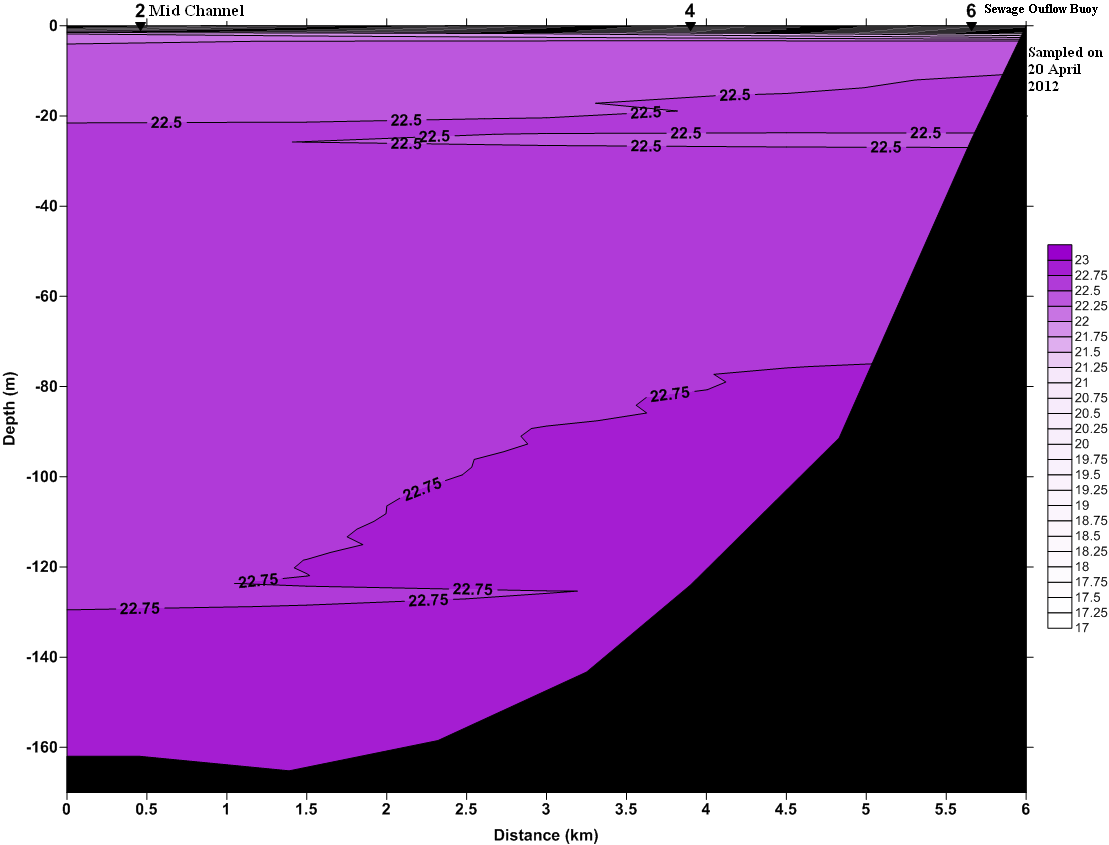
| Sampled on 20 April 2012 |
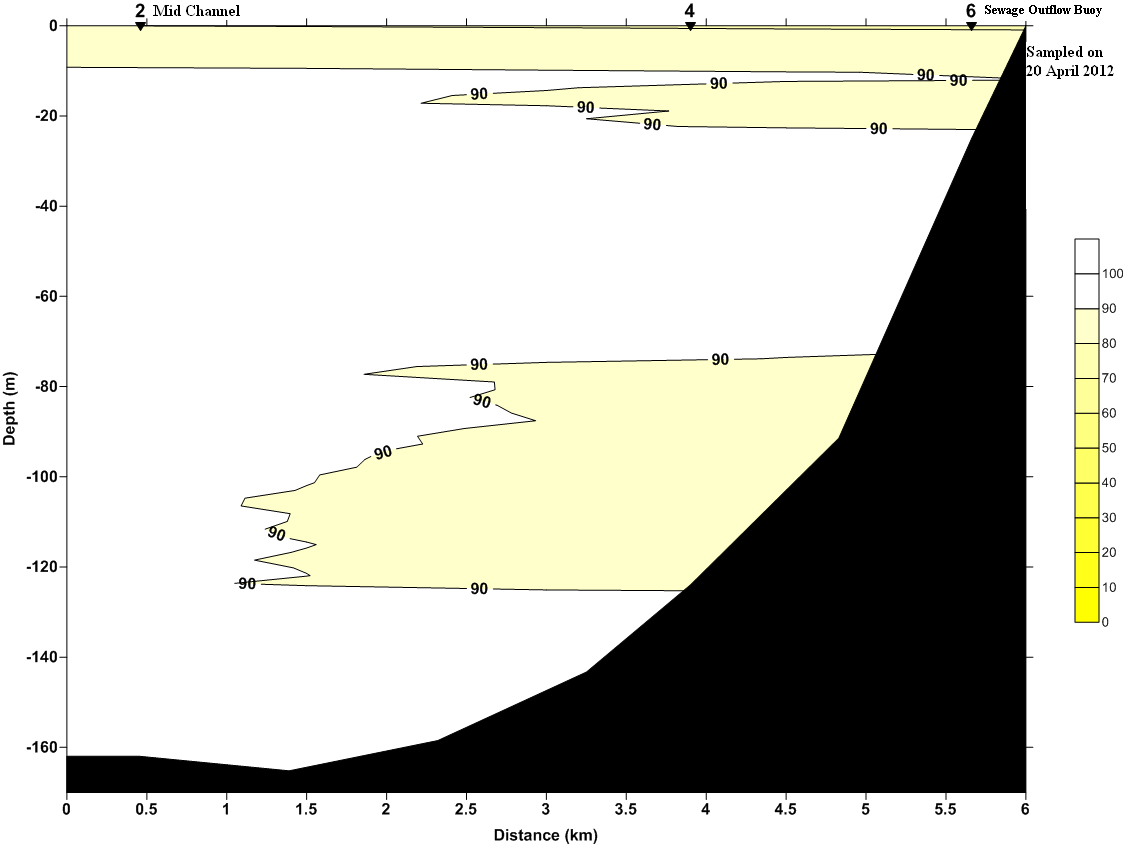 |
Transmissivity
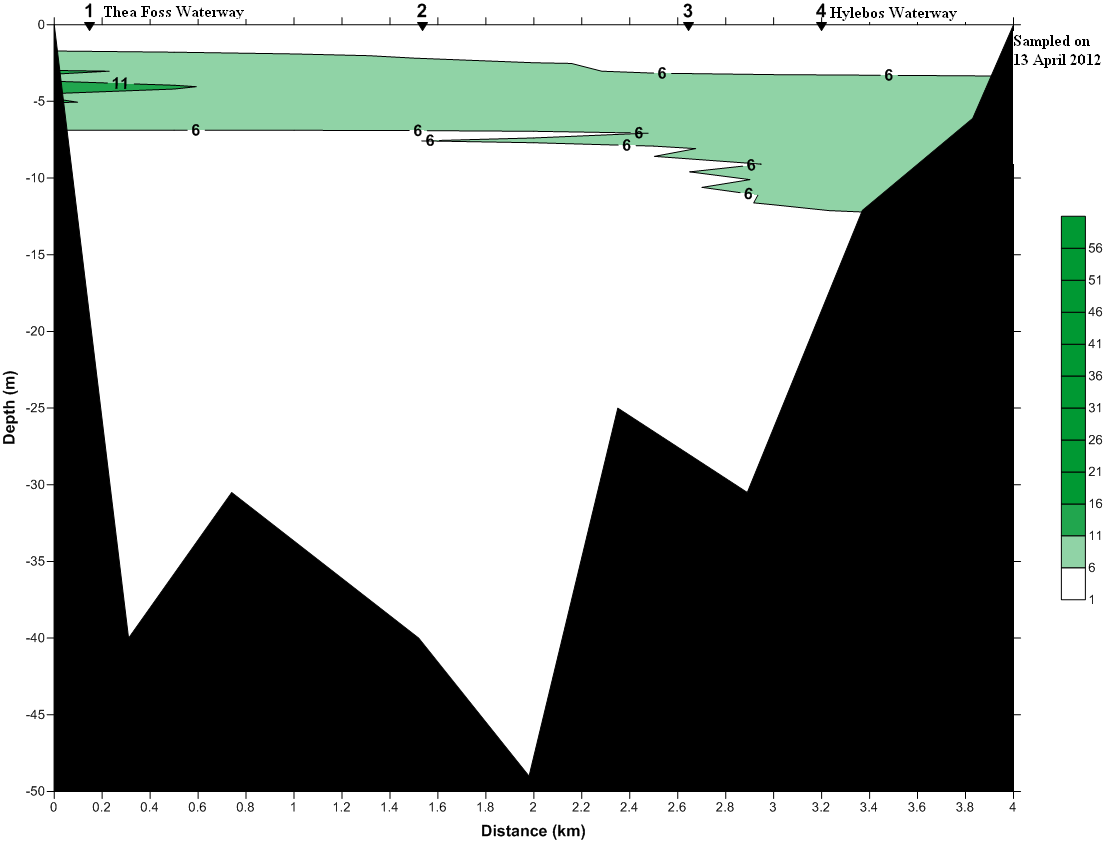
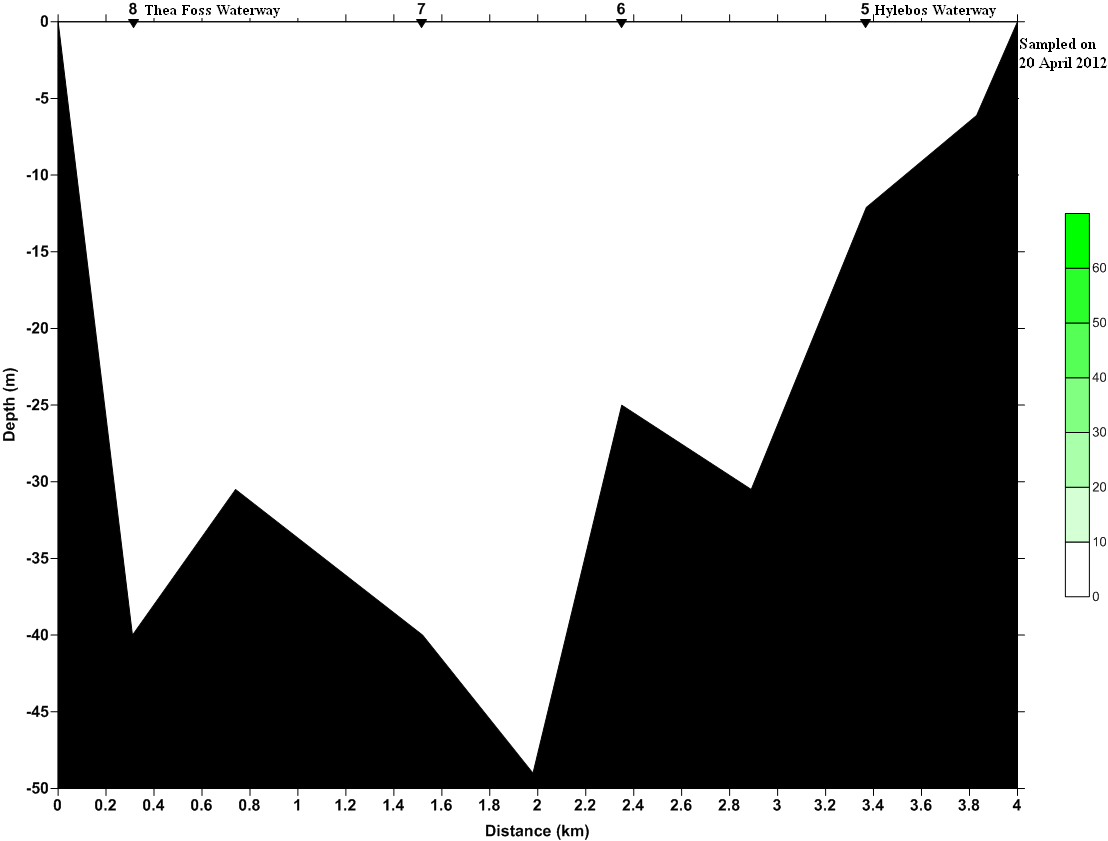
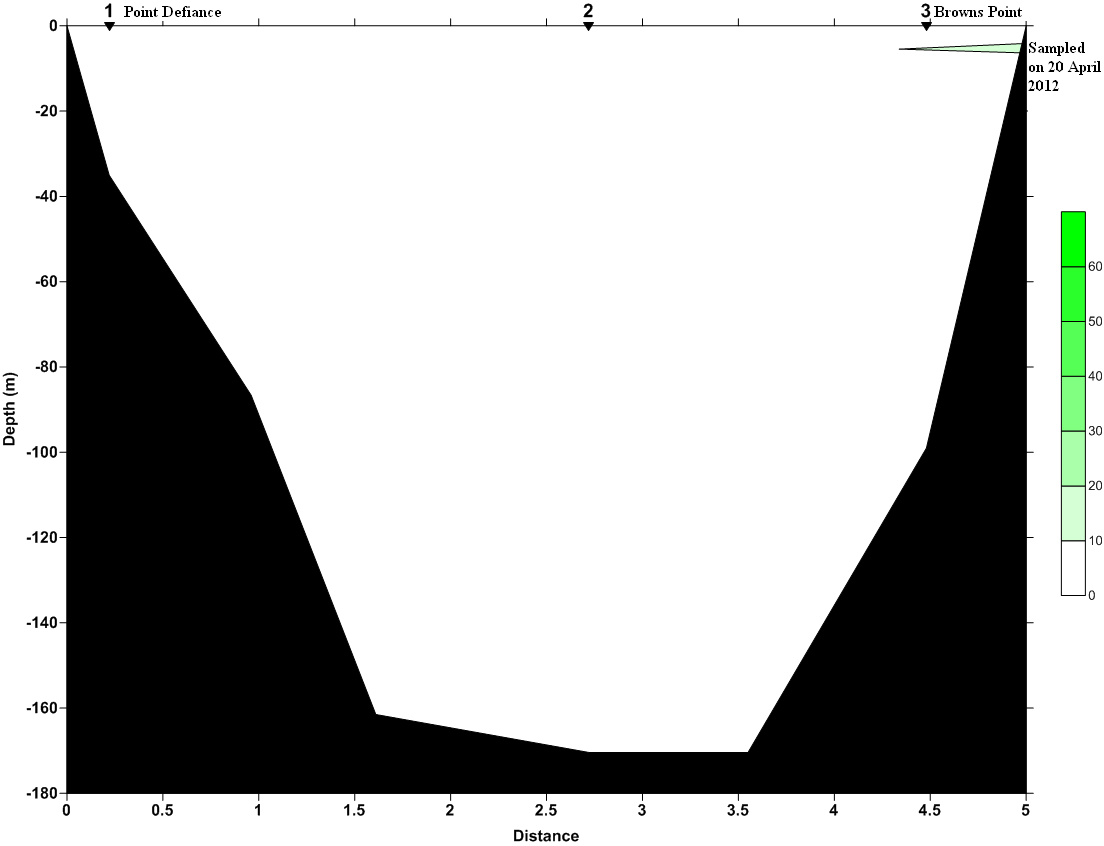
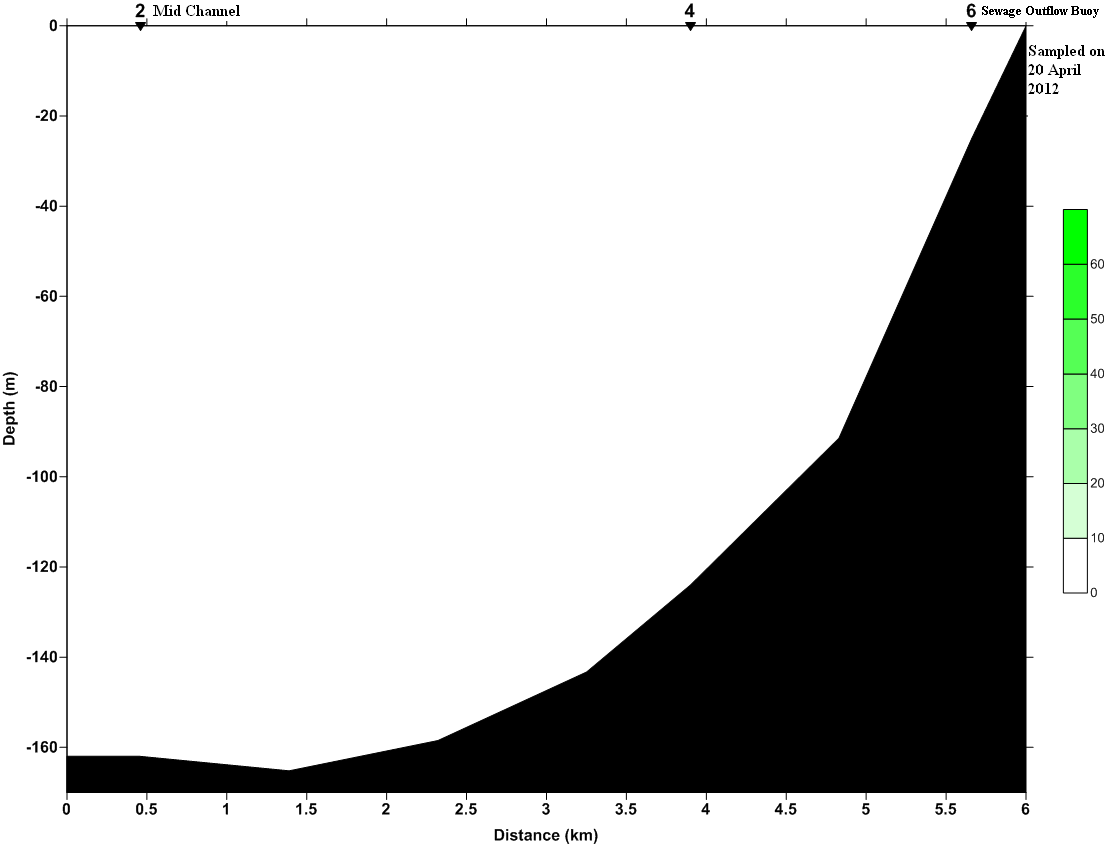
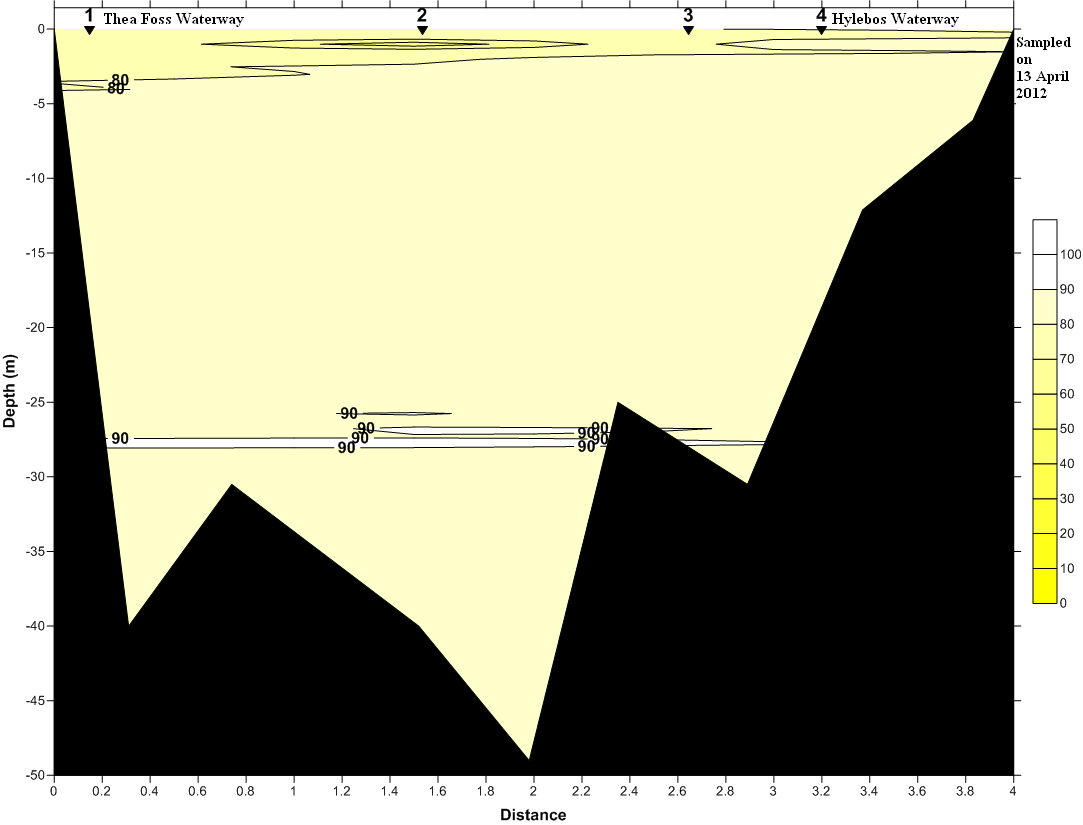
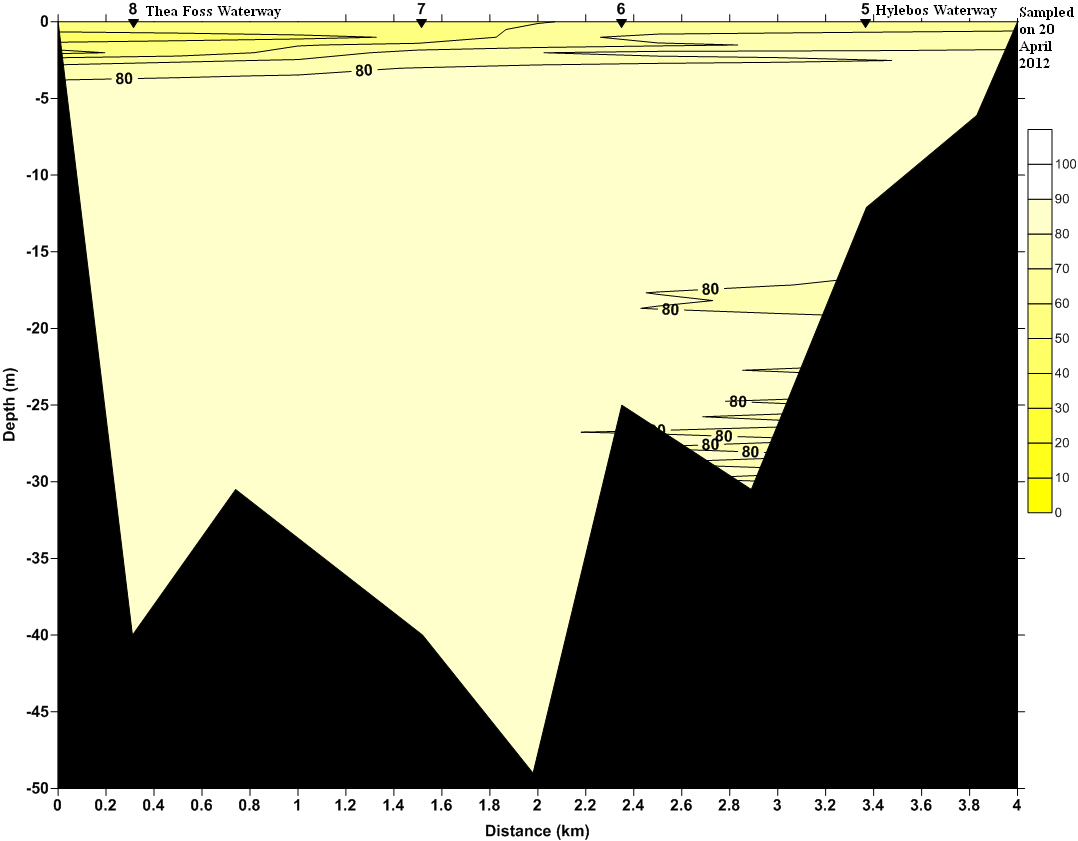
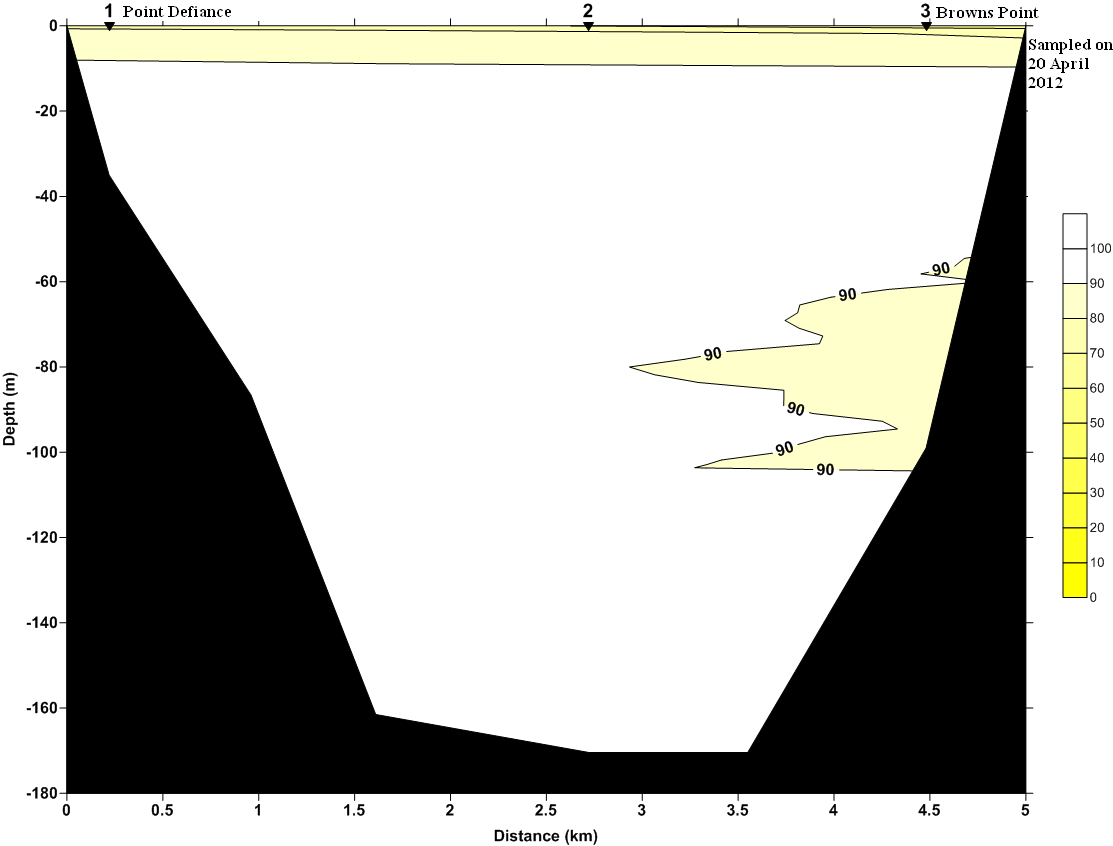
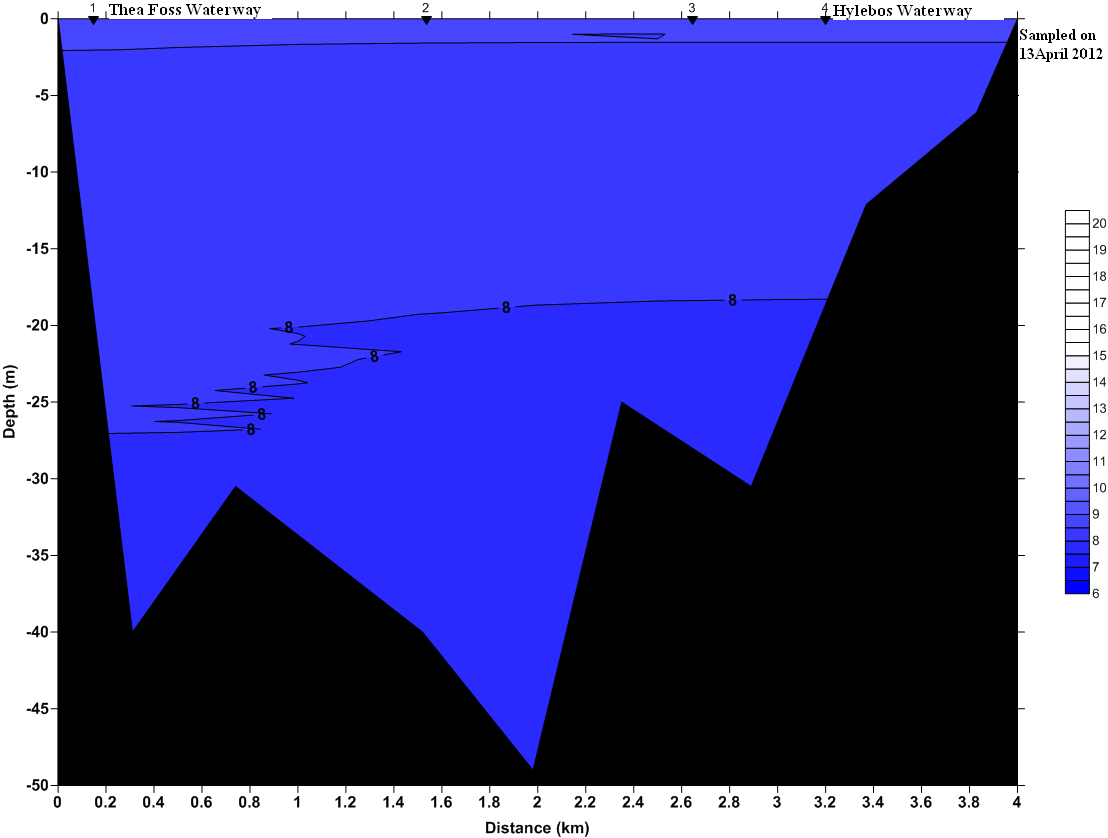
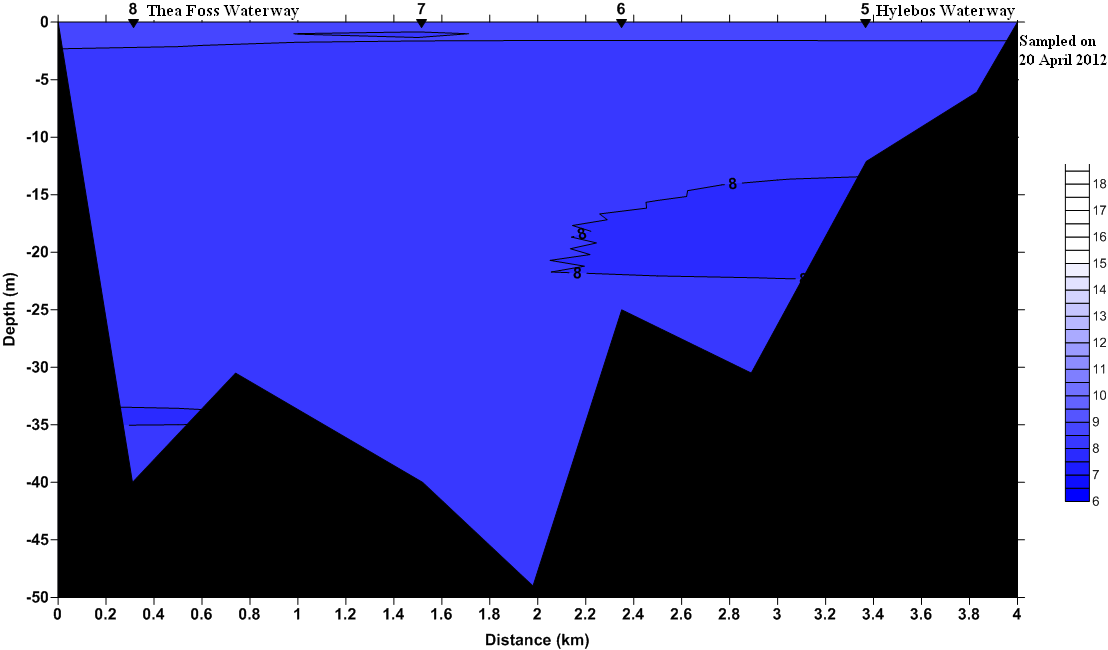
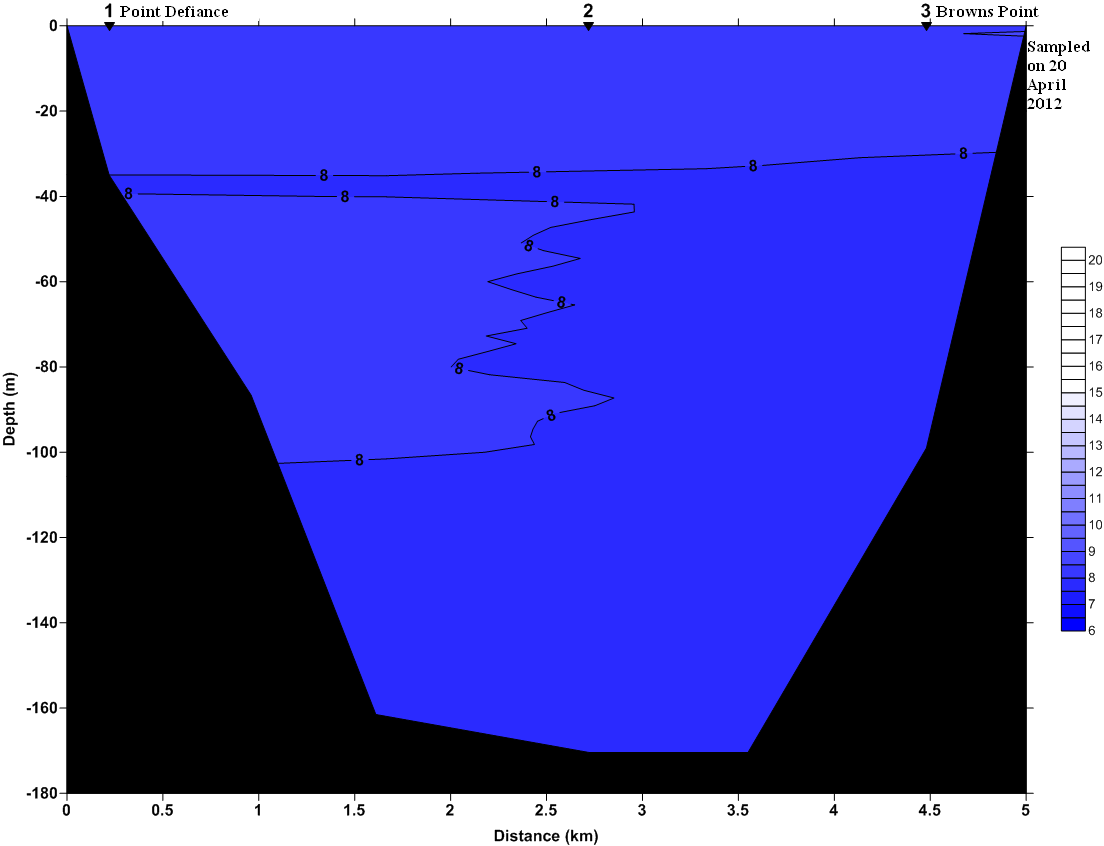
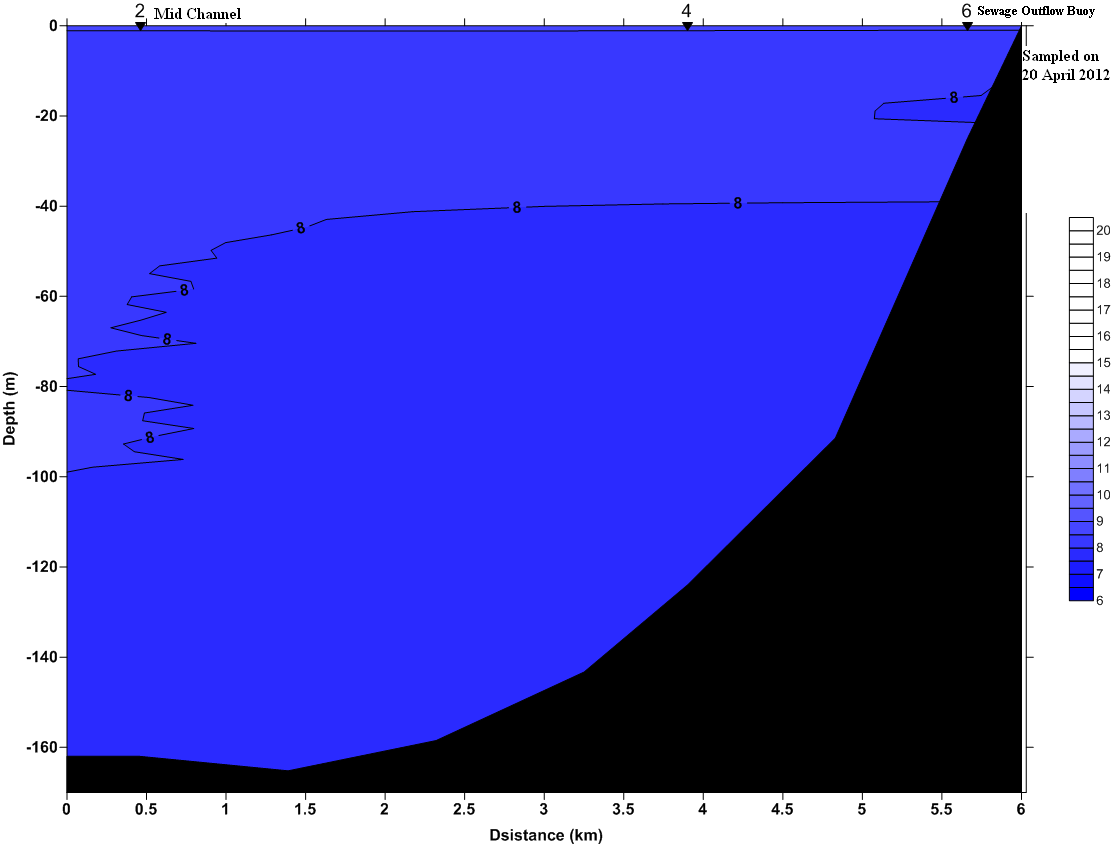
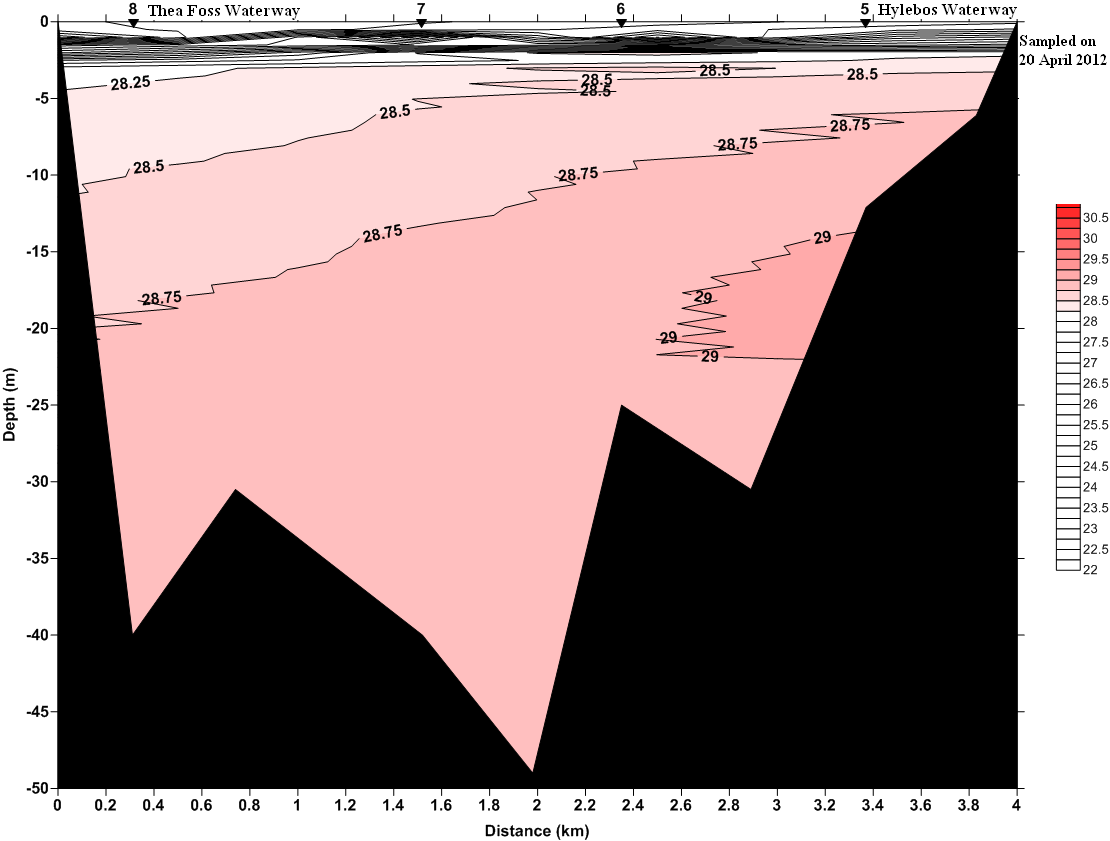
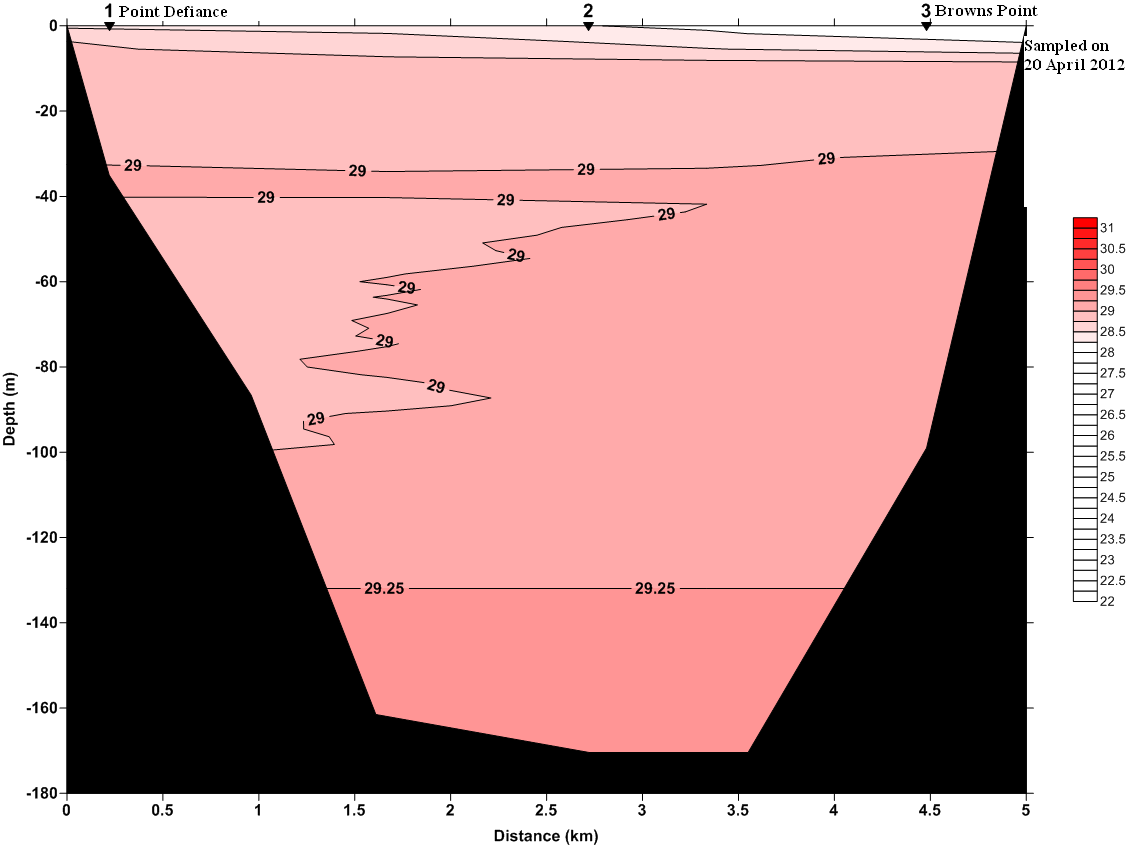
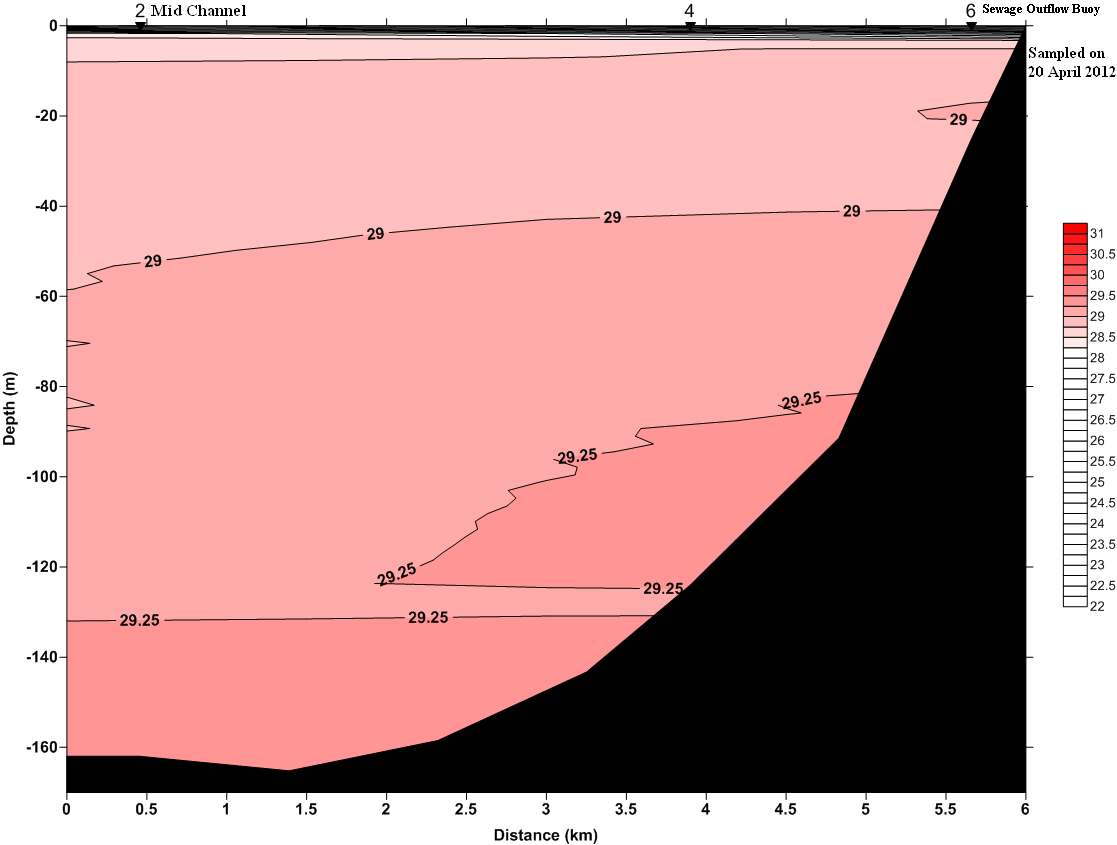
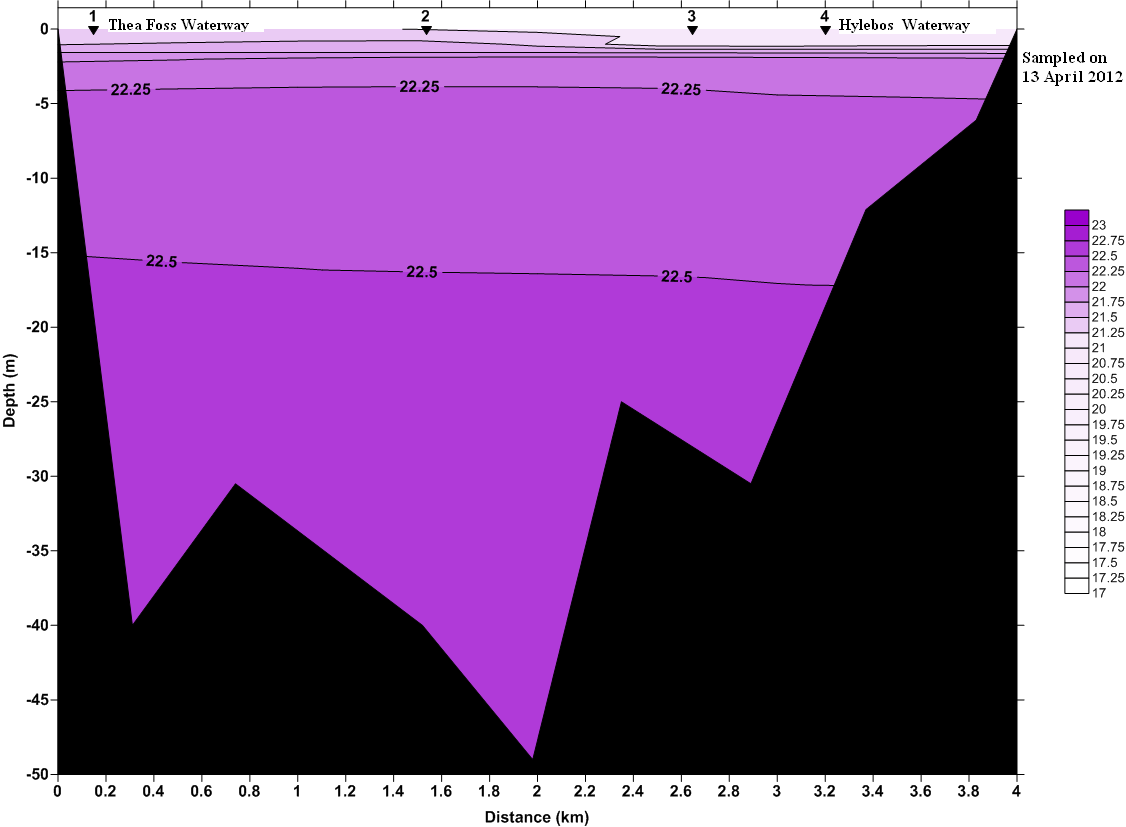
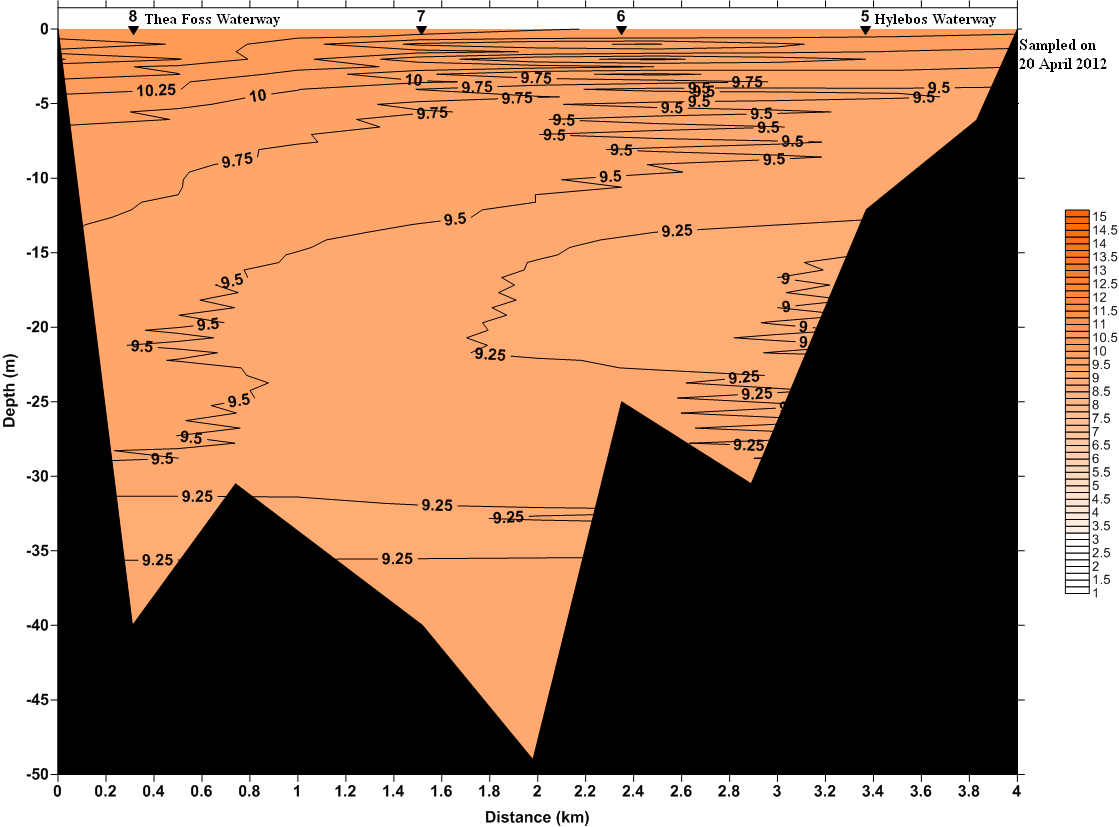
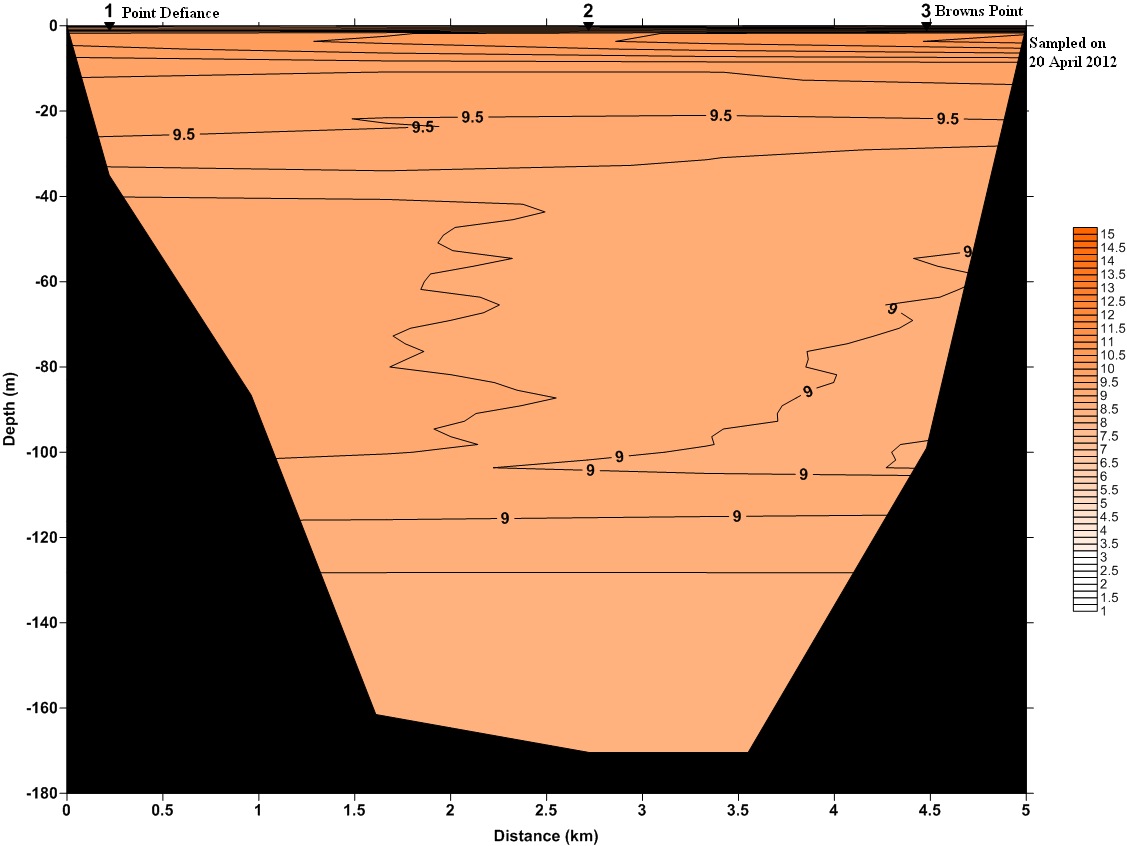
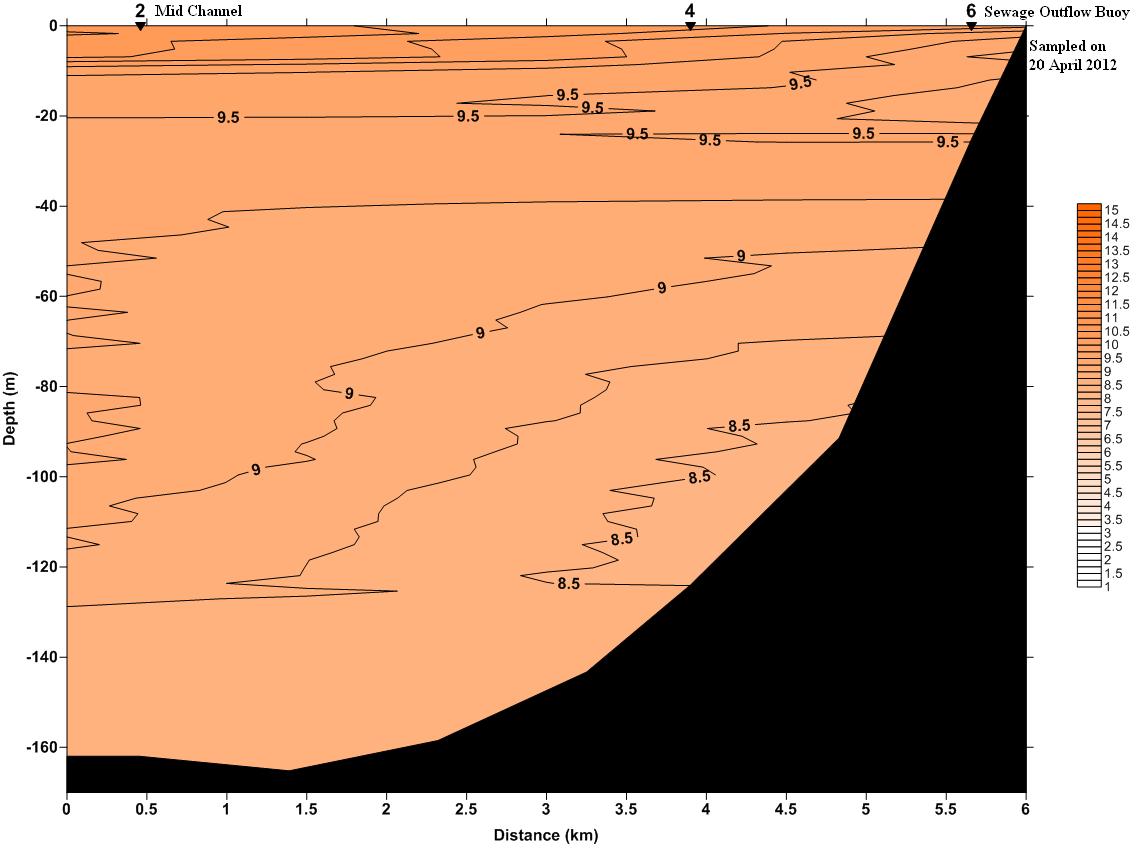
CTD transmissivity results on the 20th compared to the 13th show an increase in suspended particles in the upper 4 meters of the water column along the transect extending from the Thea Foss
Waterway to the Hylebos Waterway. On the outer bay transect, the upper 10 meters show a relatively higher concentration of suspended particles than the remaining water column. From the Mid
channel to the waterways a layer of suspended particles extends deeper into the water column towards the waterways from the outer bay. There is also an increase in transmissivity at a depth of
approximately 70 to 125 meters extending from the waterways towards the mid channel, this could be an indication of effluent discharge from the Central Tacoma Wastewater Treatment Facility.
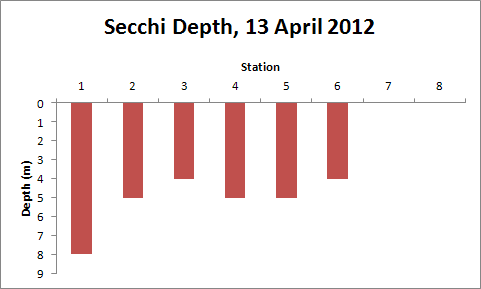
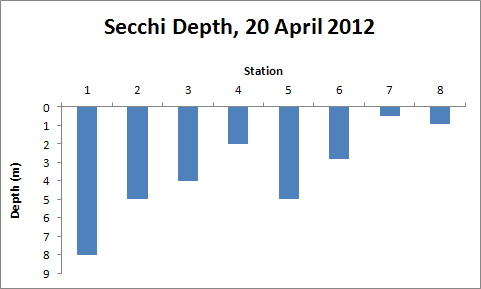
Secchi
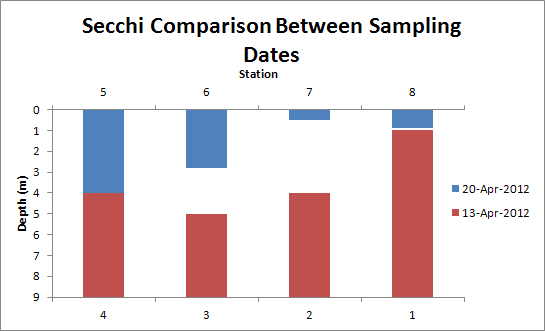
Secchi reading on the 13th were greatest at station 1 located near the mouth of the Thea Foss and lowest at station 3 located near the sewage outfall buoy. On the 20th, station 1 near Point Defiance
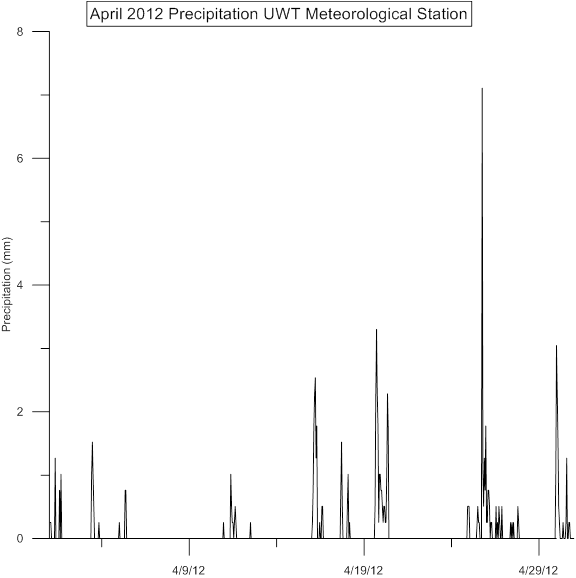
was the highest while station 7 near the mouth of the Puyallup was the lowest. Comparison of two sample days show a decrease in secchi depth corresponding to increased river discharge caused by heavy precipication.
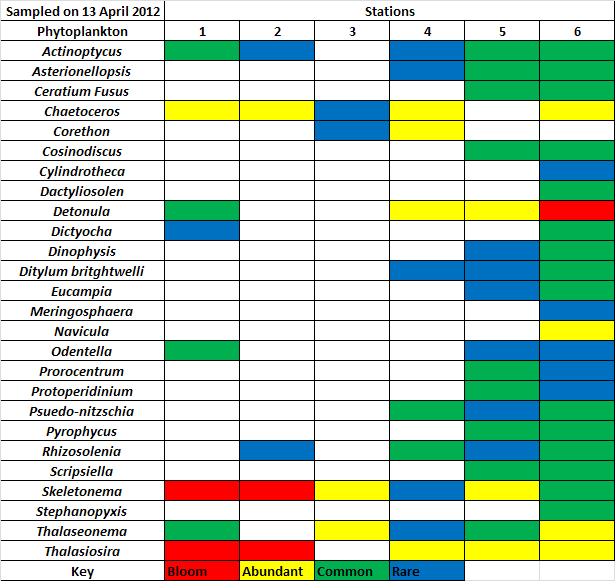
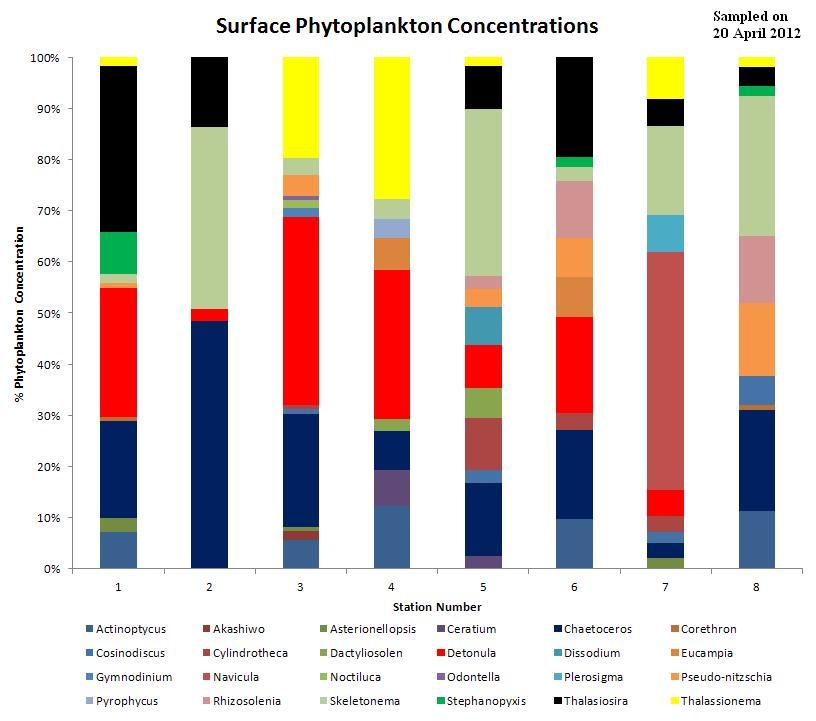
Phytoplankton
Phytoplankton Net Results
 Phytoplankton Results
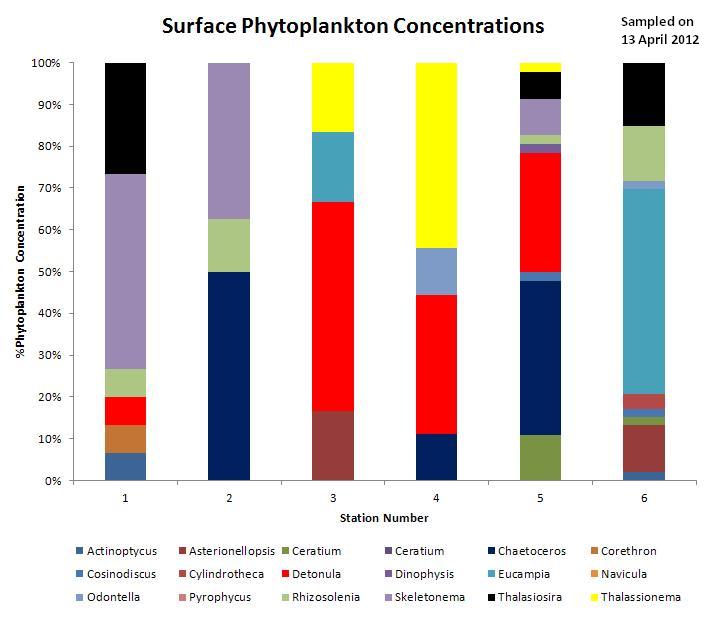
Phytoplankton genera was widely variable amongst all stations on April 13th. Detonula spp.was noticeably present at stations 3, 4 and 5. The outermost stations, 5 and 6, had the greatest genera
diversity. Station 2, located at the mouth of the Puyallup River, had the lowest genera diversity.
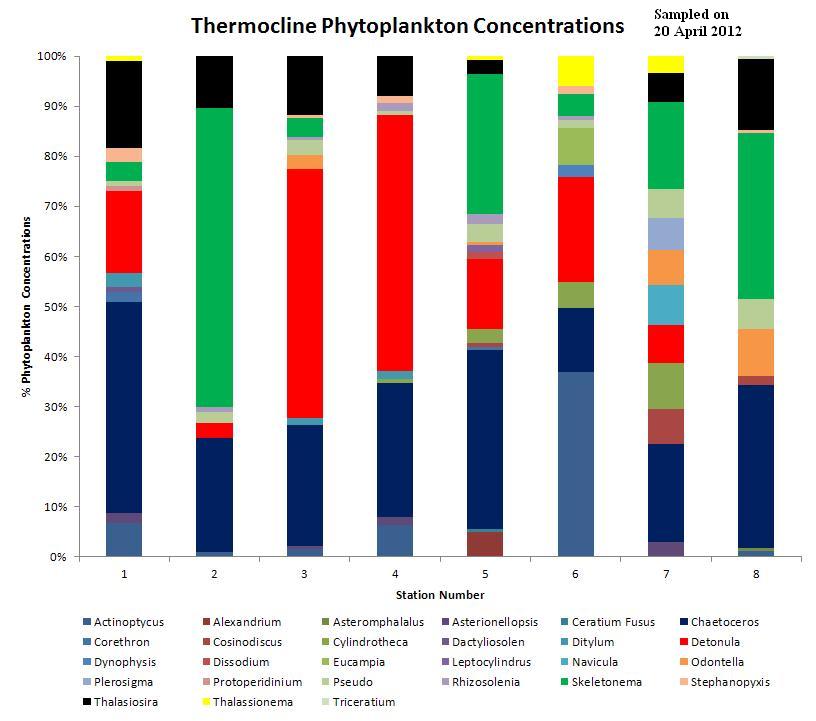
Detonula spp., Chaetoceros spp. and Skeletonema spp.were found in greater concentrations on April 20th in both the thermocline and surface. There was greater overall genera diversity on the 20th
compared to the 13th. Station 2 on the 20th had an increase in phytoplankton concentration and diversity compared to the 3th, presumably due to the increase in nutrients from the rain event.
Station 2, sampled on the 20th, located in the outer bay had the lowest phytoplankton diversity.
Nutrients
Five nutrients were tested within QMH waters. Dissolved inorganic nitrogen (DIN) is most commonly found in marine waters in the forms of NH4, NO3, and NO2, of which all are primary sources of nitrogen for phytoplankton
(Rensel 1991). PO4 is a primary source of phosphorous for phytoplankton and is essential in metabolic processes. Phosphorous may be limited in areas highly influenced by rivers due to the high concentrations of nitrogen
carried in their waters (Rensel 1991).
Si(OH)4 is incorporated into the cell walls of diatoms and is essential to their production (Rugdale et al. 2001). In periods of high phytoplankton production DIN, PO4 and Si(OH)4 are absorbed out of the system, in turn
reducing concentrations.
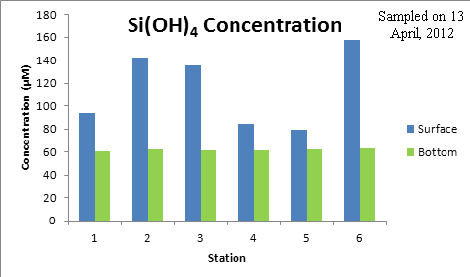
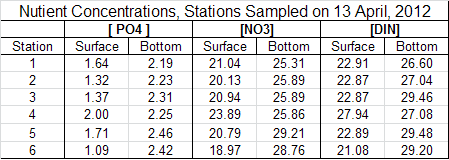
Nutrient results from April 13th, 2012 show that Si(OH)4 was variable at the surface while consistent at the bottom. Station 6 had the highest concentration, while station 4 had the lowest. All stations had higher
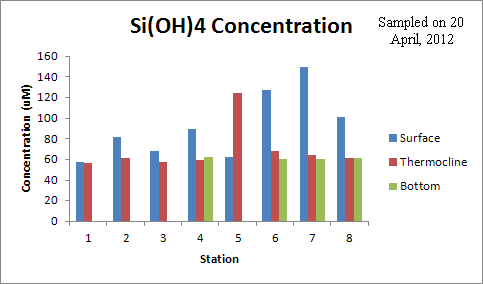
concentrations at the surface than the bottom. On the 20th of April, concentrations of Si(OH)4 were highest at the surface at station 7 and highest at the thermocline at station 5, while the bottom concentrations
were insignificantly variable. All stations had higher Si(OH)4 concentrations at the surface than the thermocline, except at station 5 where the thermocline concentrations were much greater than the surface.
 |
 |
 |
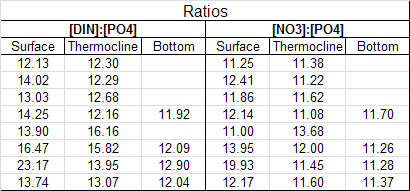 |
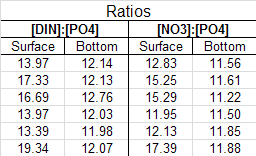
On April 13th, 2012, the ratio between phosphate and nitrate were lowest at station 3 with a ratio of 1: 11.20, and highest at station 6 with a ratio of 1: 11.88. The ratio between phosphate and nitrate on the 20th of
April was lowest at station 1 with a ratio of 1: 11.24, and highest at station 7 with a ratio of 1: 19.91. Both stations had ratios of between 5-20, indicating a normal system, where neither phosphate nor nitrate
was in short supply (Rensel et al. 1991).
Dissolved inorganic nitrogen (DIN) and phosphate ratios were consistent in the bottom waters on both sampling days. On the 13th DIN to phosphate ratios in the surface were approximately 12, with the
exception of station 6 were the ratio spiked to 19.34. The rise in the ratio may possibly be due to its location near a sewage outfall at Puget Creek or from the Puyallup River plume extending to that area.
Phosphate to nitrate ratios showed similar trends, with station 6 having the highest ratio. On the 20th, the highest DIN to phosphate ratio is at station 7 with a value of 23.17. The elevated ratio may be due
to the station location at the mouth of the Puyallup River. Phosphate to nitrate ratios were similar to DIN to phosphate ratios, with station 7 having the highest ratio.
Sediment and TOC
Sediment and TOC
|
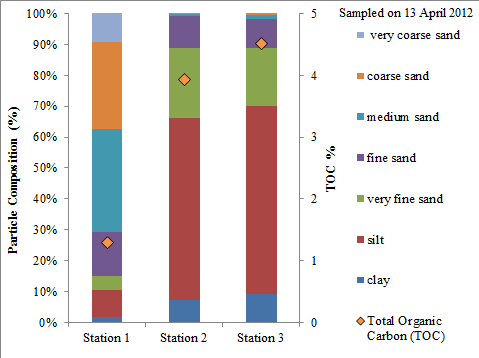
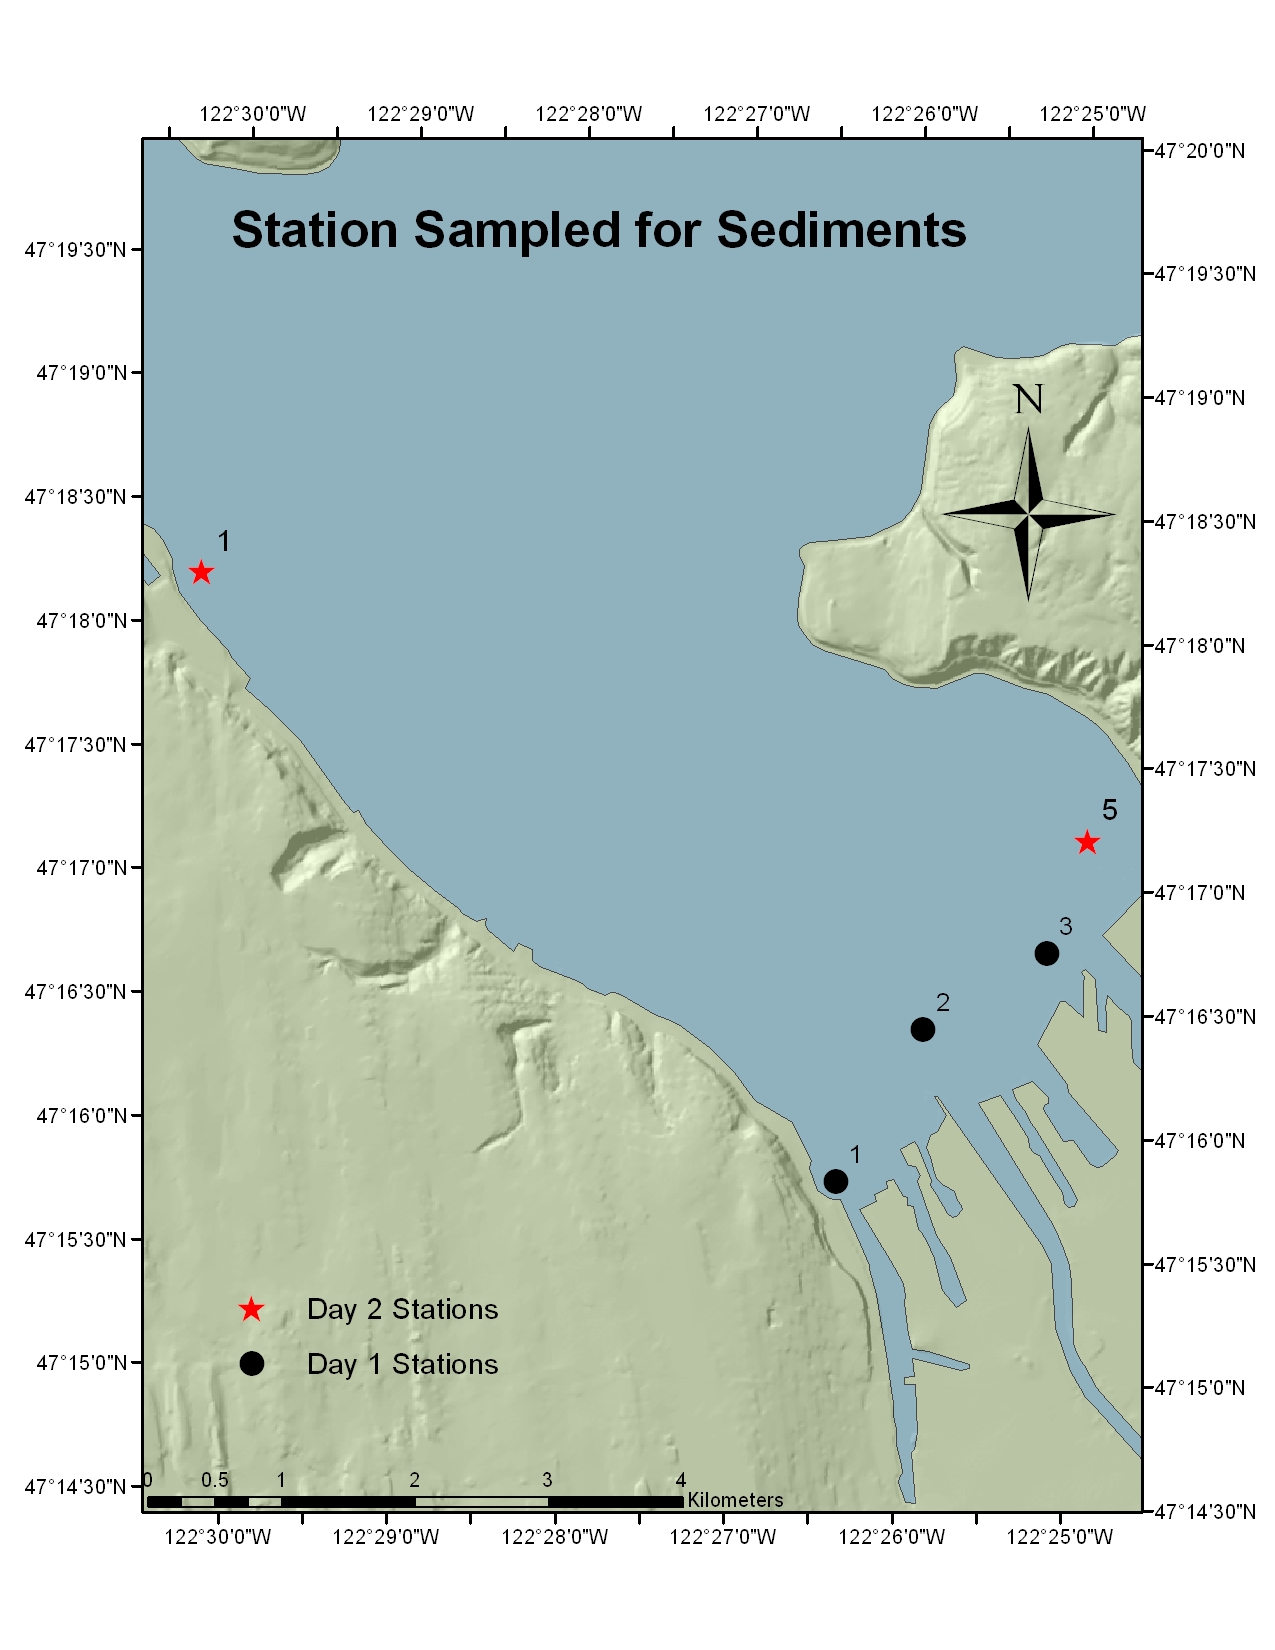
On April 13th, sediment analysis results show that station 2 and 3 were similar in composition, presumably influenced heavily by sedimentation of the Puyallup River. Station 1 is located outside
of the Thea Foss, and had relatively coarser particle composition. Relatedly, the %TOC was higher in station 2 and 3 where the finer sediments provide a larger surface to volume ratio for the adsorption of organics.
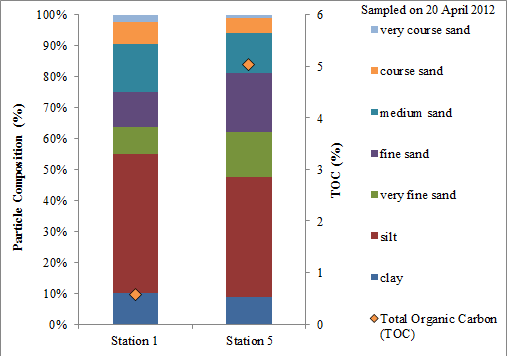
On the 20th, station 1, located near Point Defiance and station 5, located near the mouth of the Hylebos waterway showed similar grain size composition. However, the TOC content was much higher
at station 5, this could be attributed to the close proximity to the sewage outfall.
Expected nutrient concentrations are low where phytoplankton abundance is high; however the results from these samples do not follow this trend. For example, station 3 contained 5 phytoplankton genera in bloom; however the
DIN to Phosphate ratio and the Nitrate to Phosphate ratio were average in comparison to the other sampled stations. These results may be skewed as a result of a lack of phytoplankton identification experience.
References
Rensel and Associates. 1991. Nutrients and phytoplankton in Puget Sound. Seattle (WA): EPA: 150p.
Rugdale RC, Wilkerson FP. 2001. Sources and fates of silicon in the ocean: the role of diatoms in the climate and glacial cycles. Scientia Marina 65(2):141-52
[Main] [Introduction] [Methods] [Results and Discussion] [Data Repository]
| 