 |
The SurferPlot figures run south to north for the San Juans profiles. The temperature profile measured by the CTD indicated relatively constant temperatures throughout the water column and the absence of a thermocline at all stations. The strong tides during the weekend caused high mixing to occur which resulted in the constant temperatures throughout the water column. Typically if strong tides were not present and strong mixing is not occurring stratification would occur throughout the water column. Surface water warmed by the sun would reside on the surface with cooler denser water stratifying below. The profile was well mixed due to the perigee super moon as described in the introduction. (NASA).
 |
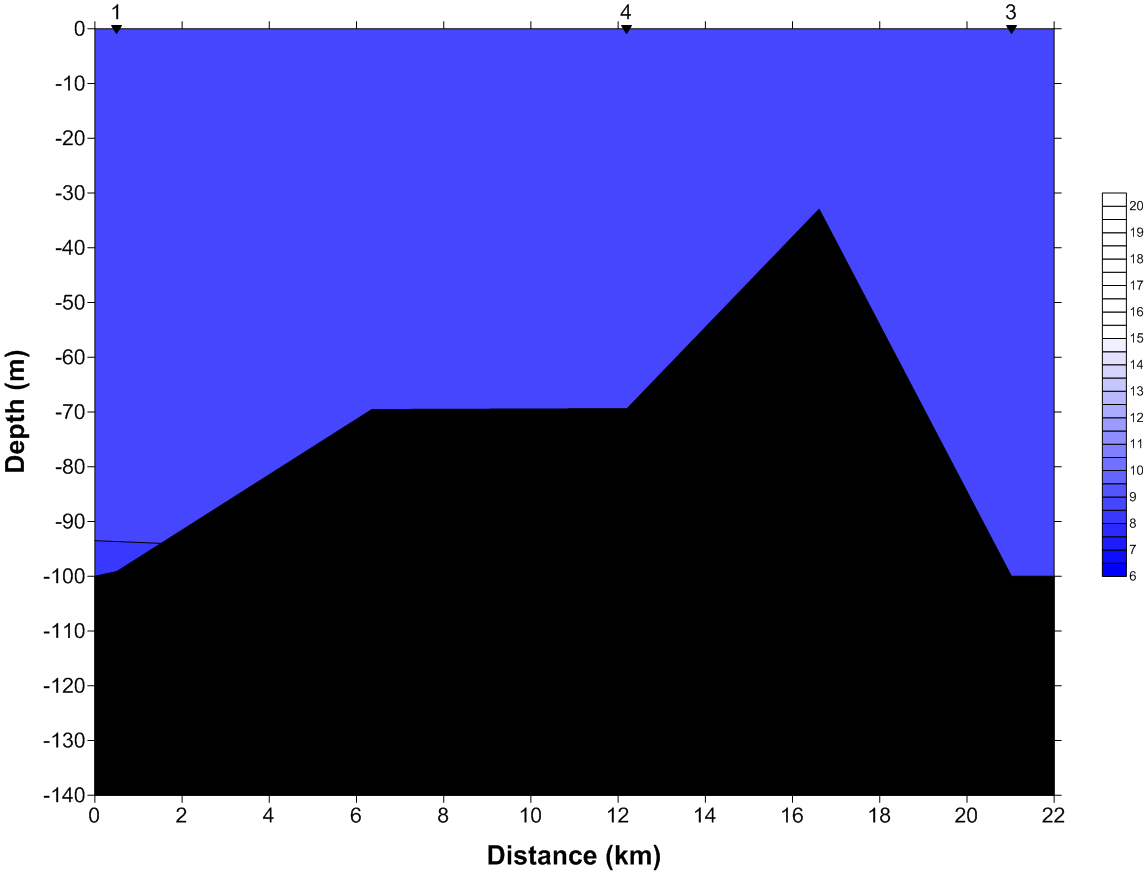
Before conducting this study it was predicted that the salinity content would be high within the waters at the bottom of the channel and low within the surface waters. This is because saltier water is denser and as a result, it sinks to the bottom of the channel (Trujillo and Thurman 2011). The salinity is highest at the bottom becuase the Pacific Ocean water is coming in from the strait, and the surface water has freshwater exiting the channel which is indicated by the low salinty at the surface.
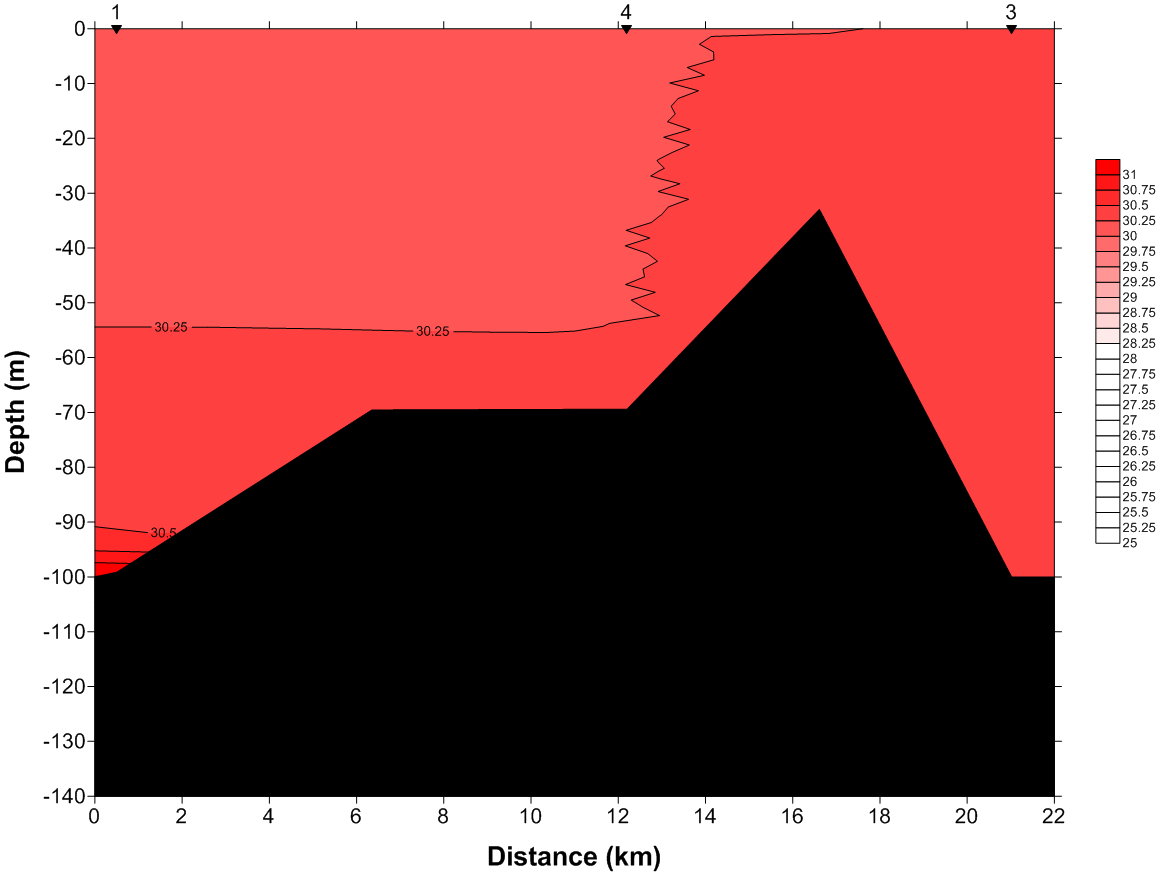
CTD Density (Sigma-T) Profile
 |
Prior to beginning this study, it was hypothesized that as the depth of the channel increased, the density would also increase. This is normally the pattern observed for estuarine systems, since salty cold water is denser and ends up sinking to the bottom of the channel (Trujillo and Thurman 2011). After referring to the density profile, it was determined that the only station that showed density stratification at all was station 1. As a result, the bottom waters of the channel were denser than the surface waters in this area. Stations 4 and 3 were very well mixed, therefore the density remained the same at all depths. The major driving force of density is salinity, which is indicated by the similarity in the profiles, which is typical in estuary systems. However, there is a large drop-off within station 1 and this prevents the waters from circulating.
CTD Dissolved Oxygen (mg/L) Profile
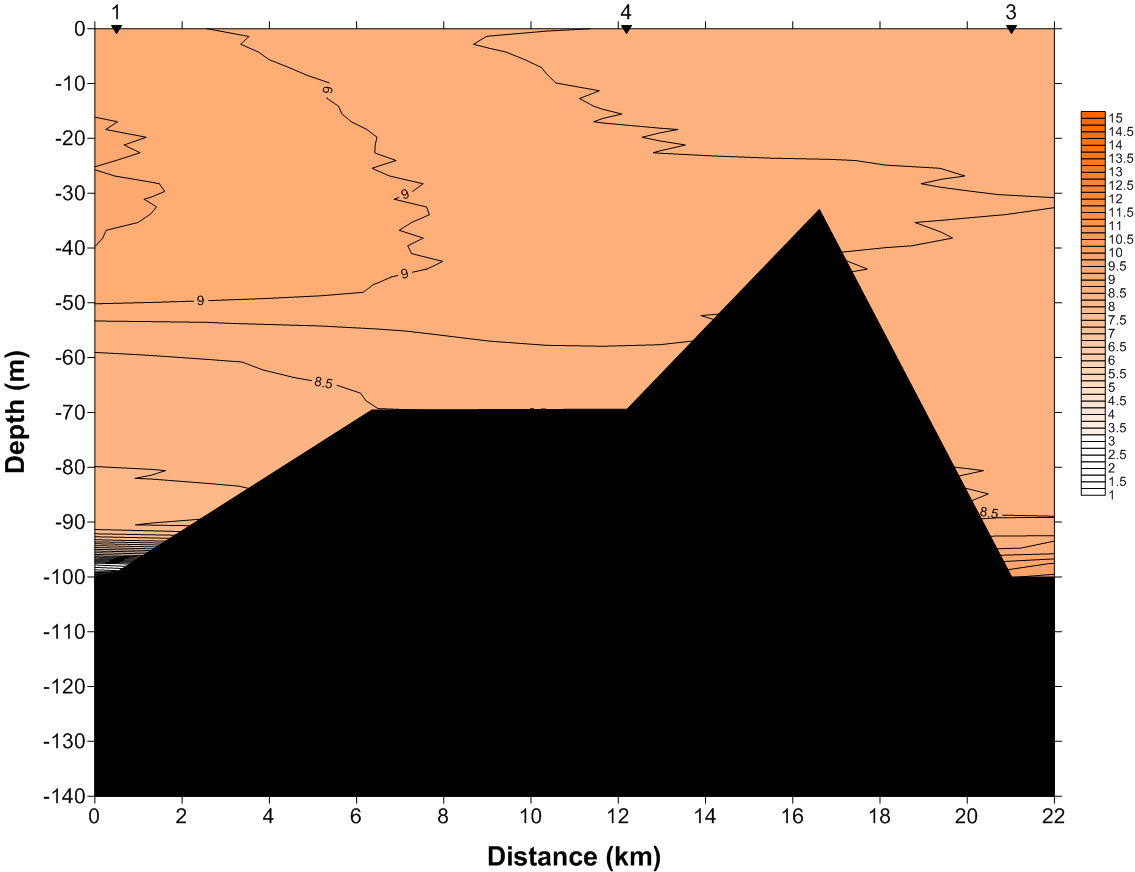 |
When it comes to dissolved oxygen concentrations, it was predicted that the surface waters of the San Juan channel would have the highest concentration of dissolved oxygen and the bottom waters would have the lowest concentration. The reason why more dissolved oxygen should be present within the surface waters is because the water is able to interact with atmospheric oxygen and phytoplankton photosynthesis is usually occurring at this depth (Trujillo and Thurman 2011). The dissolved oxygen profile shows that the dissolved oxygen concentrations were slightly stratified at all three stations. However, it is important to note that the stratification was weak due to high mixing from tides.
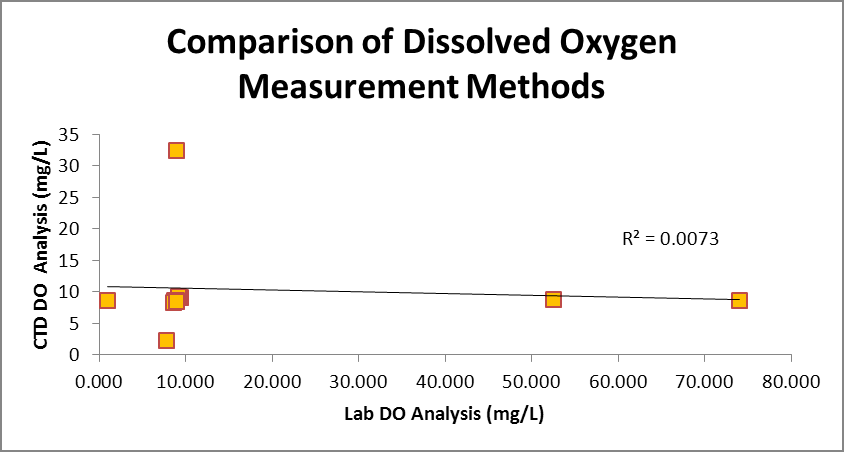
A comparison graph of the two methods used to measure dissolved oxygen concentrations across all stations show an R2 value of 0.0073. This indicates an extremely low level of data collection precision.
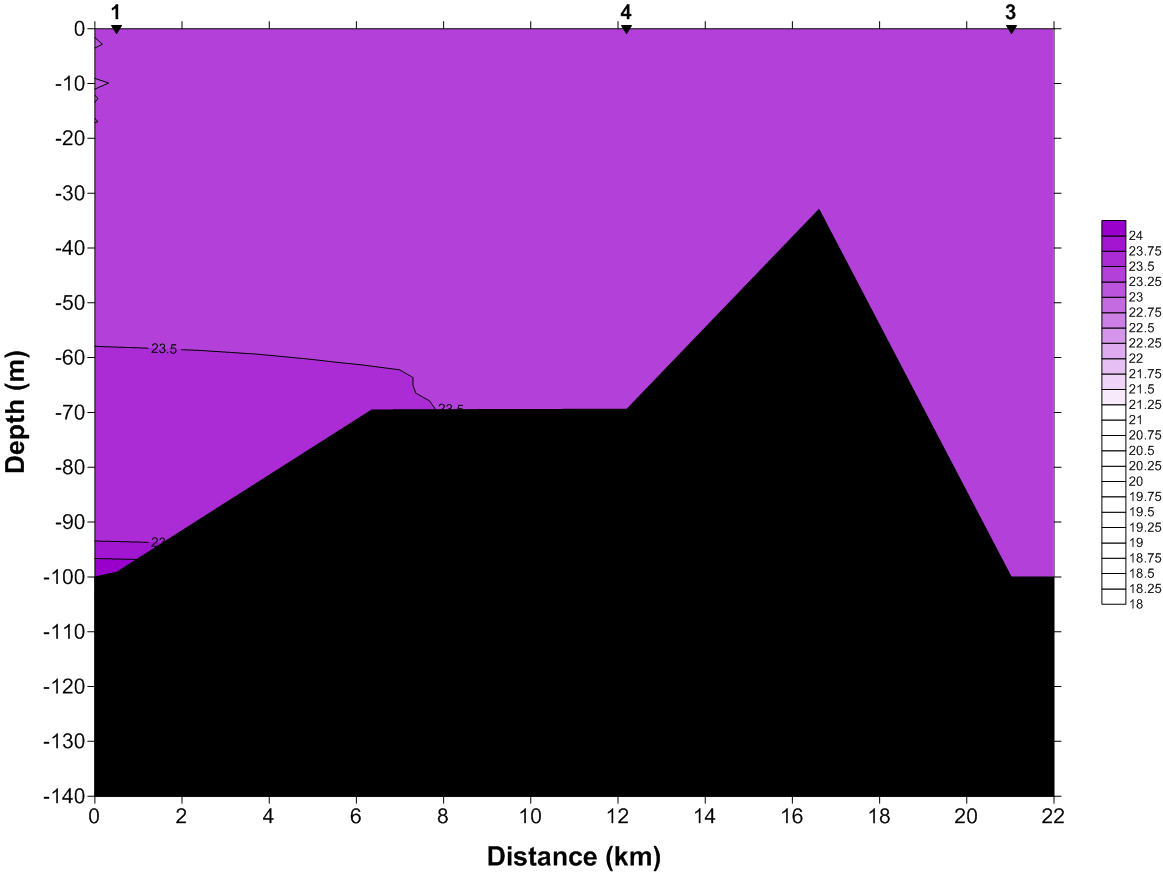
CTD Fluorescence (ug/L) Profile
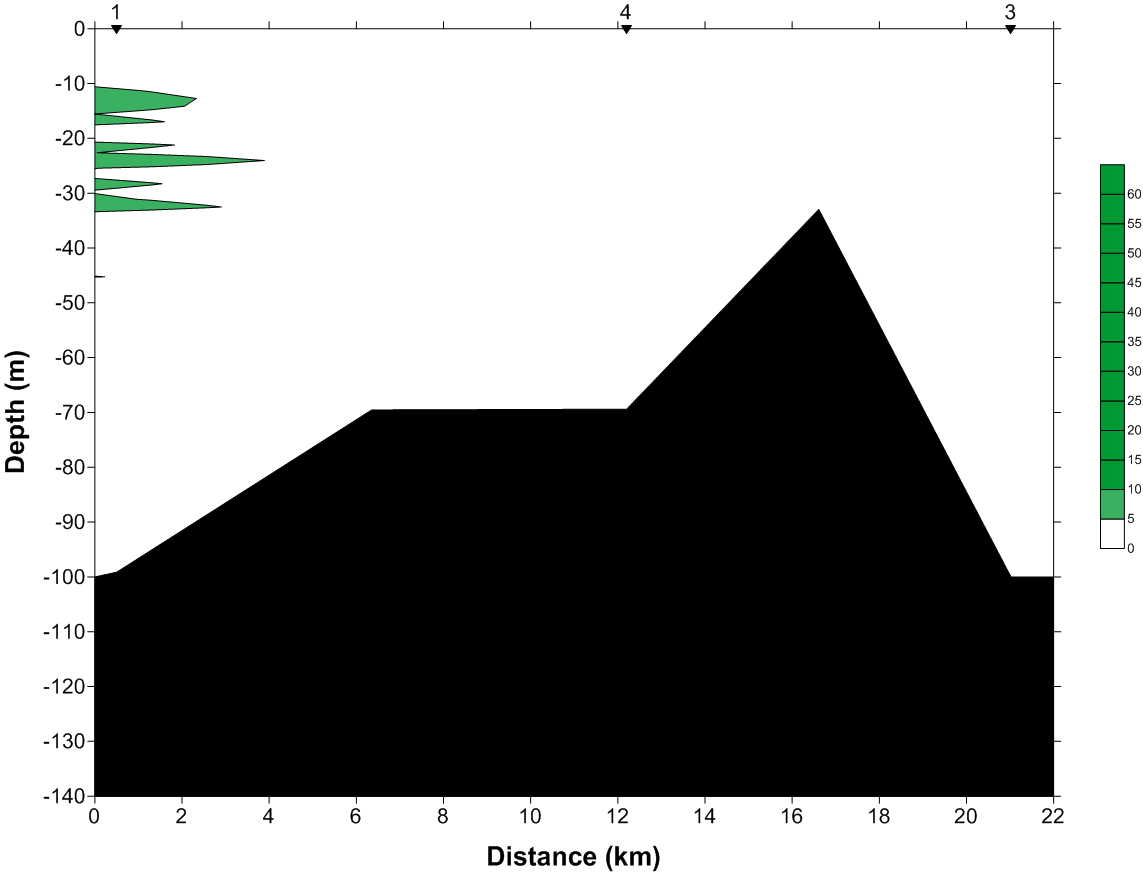 |
Fluorescence is a measure of the intensity of the amount of chlorophyll present within the water. It is known to occur when a material absorbs light from a higher energy level source and then it releases light of a lower energy level or wavelength (Rose 2012). This means that the chlorophyll is able to absorb light from the sun and emit energy at lower levels to other organisms. It is expected that higher concentrations of fluorescence would be present within the surface waters of the San Juan channel, since sun needs to be able to penetrate chlorophyll. From the fluorescence profile, it was determined that fluorescence was only present within the waters of station 1 up to a depth of 30 meters. This is due to the fact that station 1 had the highest concentration of phytoplankton present, which caused there to be more chlorophyll and an increased amount of photosynthesis occurring within this area. Stations 4 and 3 had only trace amounts of phytoplankton present within their waters and therefore no fluorescence was able to be measured.
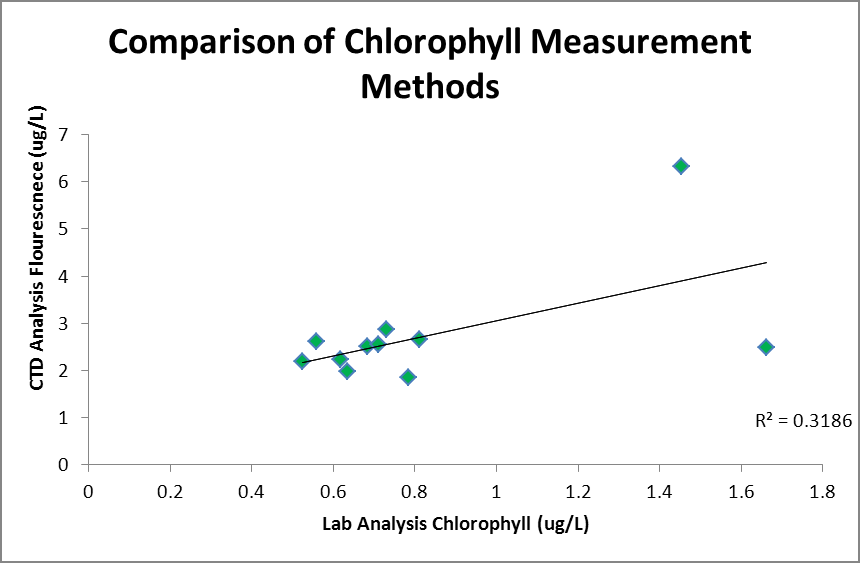
A comparison graph of the two methods used to measure chlorophyll across all stations show an R2 value of 0.3186. This indicates a low level of data collection precision.
Secchi Disk Profile
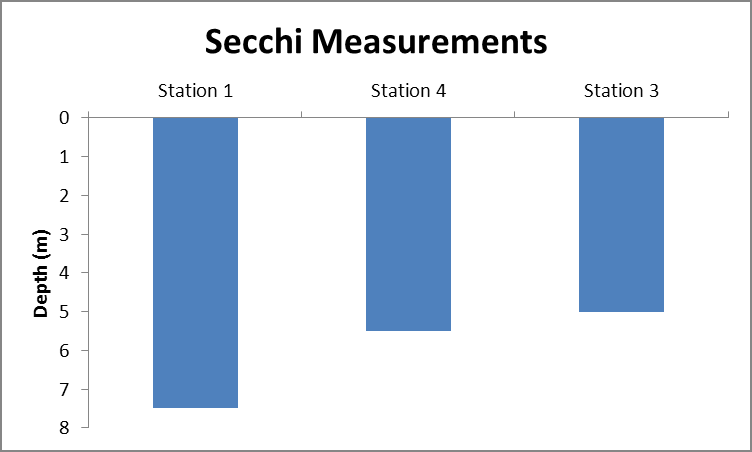
From the secchi disk graph, it was determined that surface visibility was greatest at station 1, which was located in the straits and further offshore. Station 3 had the lowest surface visibility and it was the deepest inside the channel.
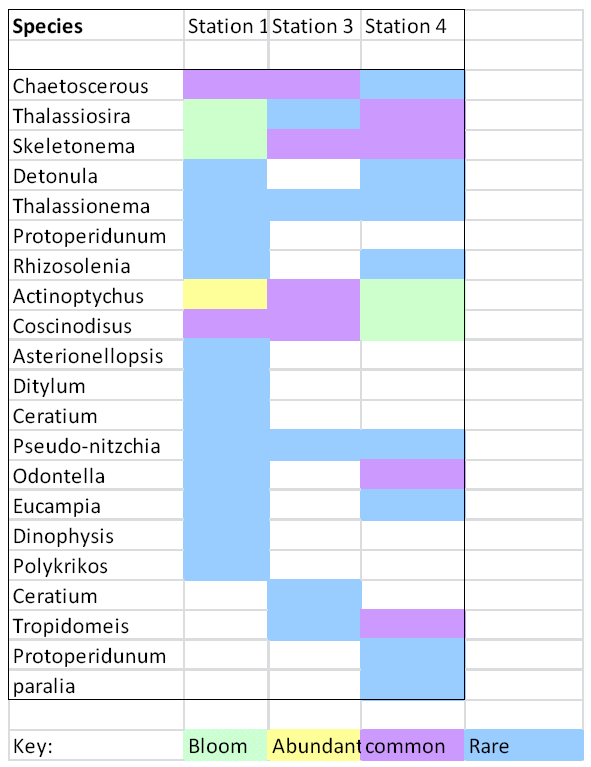
Net samples indicated that Thlassisoira spp., Skeletonema spp., Actinoptychus spp., and Coscinodiscus spp. were blooming.
Station 1 had the highest biodiversity and was further offshore and out in the straits.
Station 3 had the lowest biodiversity and was further into the channel, indicating that phytoplankton is more abundant offshore and in open water.
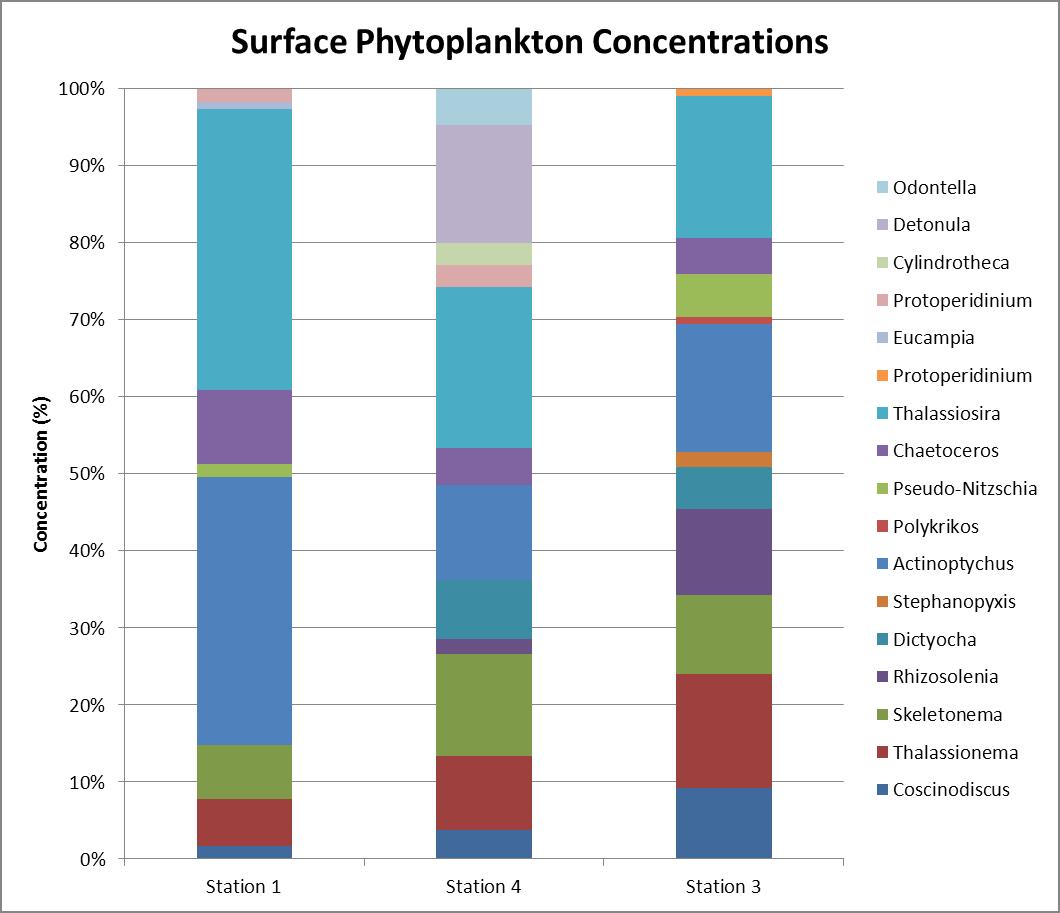
Station 1 was dominated by Thalassiosira spp. and Actinoptychus spp.in the sample, with the lowest biodiversity of all stations.
Station 3 and 4 were not as dominated by one genus but instead had more even presence of all species, and also had higher biodiversity than station 1.
This either indicates that phytoplankton were well mixed at stations 3 and station 4 or that thalassiosira spp. and actinoptychus spp. preferred the water conditions present station 1.
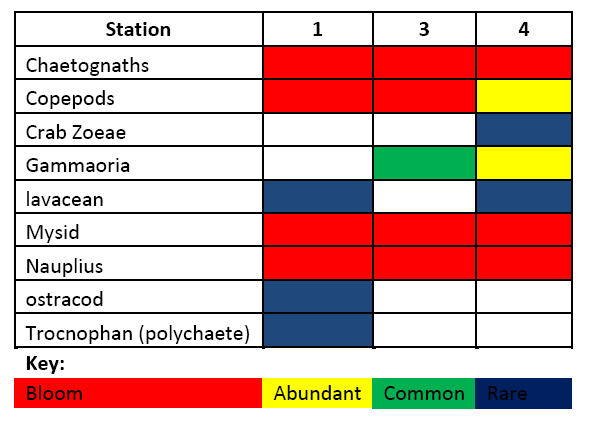
The zooplankton data indicated that Chaetognaths spp., Mysids spp., Nauplius spp., and Copepods spp.were blooming at all stations with the exception of station 4 having a smaller frequency of Copepods spp..
Lavaceans spp., Ostracods spp., Trocnophan spp., Crab Zoea were rare throughout the samples. Stations 1 and 4 both had seven different genus and station 3 only had five different genus.
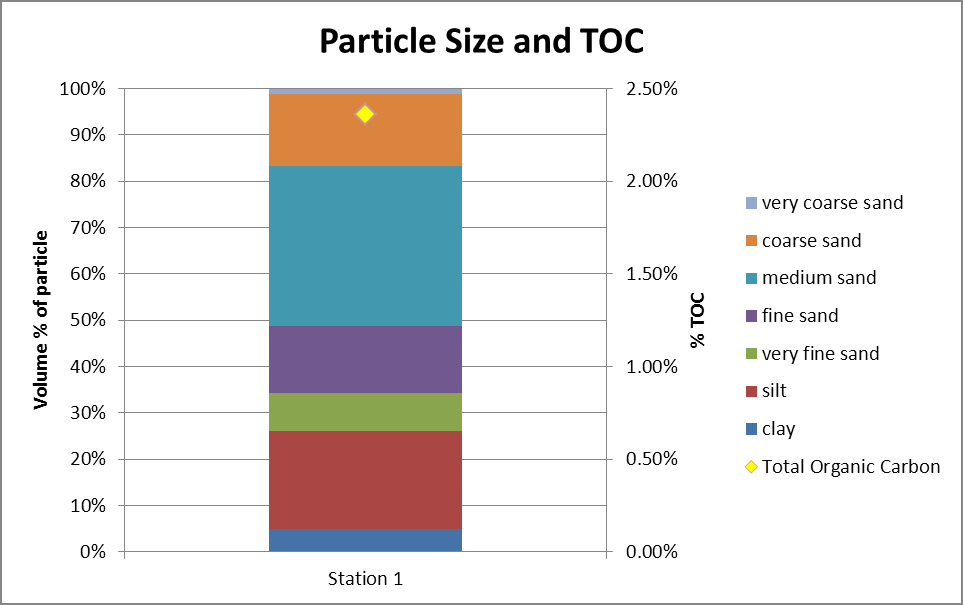
A sediment sample was only obtained at station 1. Particle size analysis indicated that station 1 is mostly composed of coarse material.
This indicates an area of high circulation possibly caused by high winds, large waves, and the inflow from rivers and seawater. High circulation and rough waters causes' coarser material to be present because finer sediment is carried away (Trujillo and Thurman 2011).
It was determined that the sediment from station 1 contained approximately 2.36% total organic carbon within its sediment.
Due to the fact that total organic content (TOC) measures the amount of pollutants contained within the sediments, it can be determined from these results that this area contains minimal pollution (Ahmad
References
Ahmad M, Bajahlan AS, Hammad WS [Internet]. 2008. Industrial effluent quality, pollution monitoring and environmental management. Environmental Monitoring Assessment 147(1-3):297-306. [Accessed 2012 Apr 25]. Available from: http://www.ncbi.nlm.nih.gov/pubmed/18228156
[NASA] National Aeronautics and Space Administration. 2012. Perigee "Super Moon" On May 5-6. [Accessed 2012 June 1] Available from: http://science.nasa.gov/science-news/science-at-nasa/2012/02may_supermoon/
Rose K [Internet]. 2012. Biological Sensors. Smithsonian Environmental Research Center. [Accessed 2012 Apr 17] Available from: http://www.lakescientist.com/learn-about-lakes/lakesensors/biological-sensors.html
>"> http://www.lakescientist.com/learn-about-lakes/lakesensors/biological-sensors.html
Trujillo AP and Thurman HV. 2011. Essentials of oceanography. New York (NY): Prentice Hall.