|
| |
Homework #2 (for due dates, see syllabus)
Book Problems:
| Problems |
Count |
| - Pick two of 3-1 through 3-14 |
2 |
| - 3-18, 3-19, 3-23, 3-25, |
4 |
| - 3-80, 3-81, |
2 |
| - 3-92, 3-93, 3-98, 3-99, 3-100, 3-101, 3-102 |
7 |
| - Pick one of 3-97 or 3-103 |
1 |
| - Pick one of 3-96 or 3-104 |
1 |
| - Pick one of 3-94 or 3-95 |
1 |
| - 3-107 |
1 |
Total Count |
17 |
Additional Non-Book Problems:
Consider a bag of M&M's with the following
composition:
| Red |
3 |
| Orange |
7 |
| Yellow |
10 |
| Green |
7 |
| Blue |
12 |
| Brown |
19 |
Assume that sampling is done with
replacement. If three candies are selected, calculate the following probabilities:
- The probability of getting three
yellows?
- The probability of getting first a
red, then a yellow, and lastly a blue?
- The probability that the set
contains exactly one red, one yellow and one blue?
- The probability that the set
contains at least one warm color (i.e., at least one red, yellow, or orange candy)?
Assume that sampling is now done
without replacement. If three candies are selected, calculate the following
probabilities:
- The probability of getting three
yellows?
- The probability of getting first a
red, then a yellow, and lastly a blue?
- The probability that the set
contains exactly one red, one yellow and one blue?
- The probability that the set
contains at least one warm color (i.e., at least one red, yellow, or orange candy)?
Questions and Answers for HW #2
Question 1
I am confused on part(c). Does it mean picking a set of 3 at the same time or picking a
set of 3 with one at a time? Thank you for letting me know.
Answer 1
When sampling is done "with replacement", the implication is that you draw
one sample, record its identity, and then put it back into the pool before drawing again.
Sampling "without replacement" refers to a situation where once an item is
selected, it can no longer be selected again.
In this case, imagine that the sample of m&M's are in a bowl.
- In the case of "sampling with replacement" - we draw a candy, record the
color, put it back in the bowl, and then draw the next candy. In this situation, the
probabilities of events stay the same from event to event (e.g., the probability of
drawing a blue is the same each time).
- In the case of "sampling without replacement," - we draw a candy, record
the color, put it aside (or eat it), and then draw the next one. In this situation, the
composition of candies changes with the removal of the candy, and so the probabilities
change from one event to the next.
I realize this doesn't directly answer your question (I was not certain I understood
your question). I hope this helps,
Solutions
The following graph shows the distribution of the hw#2 grades. You can check up
on your specific grade here.
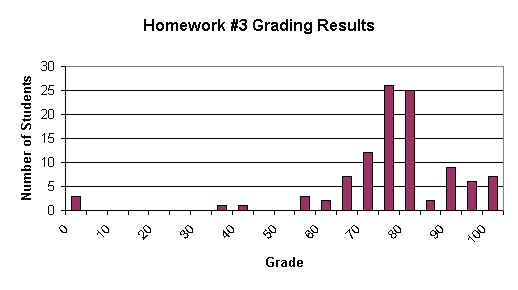
Note: The
grade for hw#2 is a random variable, and the histogram above has a slightly
"Normal" look to it.
The Formula
The grades were determined in the following way. Half of the credit was given
based on the percentage of the problems that you completed. The remaining half of
the credit was based on you success at solving three randomly selected problems.
For homework #2, our random selected process identified problems 3-23, 3-98, and 3-100
for grading. A "1" was a perfect score for each problem. The graders
recorded, on your homework, the number of points they took off. On the first page,
they recorded the number of points taken off for all three problems, collectively.
For example, if you see a "-1.2" on the first page, it means that you
received 1.8/3.0 points for the graded problems.
Your homework score (a random variable!!!) can be calculated using the following
formula:
HW = [50 * (# problems you solved / 20)] + [50 * (your score on the
three graded problems / 3)]
Some observations:
- Problem 3-23: The average grade for this problem was a 0.7. The
most common mistake was not representing the sample space in the venn diagram. the
sample space is represented by the large square drawn around the venn diagram circles.
Having the sample space representing becomes important for determing (and specifically
here in sketching) the complement of events.
- Problem 3-98: Approximately 3/4 of the class got this problem
wrong. The problem asks for the probability that the machine will fail. The
machine fails when any component fails.
P(machine fails)
The solution involves taking the complement of the event "At least one component
fails". The complement of that event is the event "No component
fails".
P(machine fails) = P(at least one component fails) = 1 - P(no component fails)
This event is the same as the event "All are successful."
1 - P(no component fails) = 1 - P(all
components successful)
Because the components are independent, determining the probability that all are
successful involves multiplying the probabilities.
1 - P(no component fails) = 1 - P(comp 1
successful)*P(comp 2 successful)* .. * P(comp 10 successful)
And finally, since all components have the same probability of success:
1 - P(no component fails) = 1 - power(P(a
successful compoent),10)
where the last step is meant to imply the probability raised to the 10th power.
- Problem 3-100. Most students got parts a and b correct.
There was much confusion on part c. Refer to the solutions for details on the
correct solution.
|