|
| |
Homework #1 (for due dates, see syllabus)
Book Problems: 1-5, 1-8, 1-11, 1-12, 2-2, 2-7, 2-18 (part b
only), 2-27, 2-30, 2-35, 2-38
Additional Non-Book Problems: none
Questions and Answers for HW#1
HW1 Question 2-38 (Posted 4/1/99)
Question:
I have a problem with this question.
- parts a and b referes to question 2-10 which in turn referes to question 2-2.
- part c referes and askes you to compare part a and b with 2-4.
questions 2-2 and 2-4 have nothing to do with each other correct?
Response:
You are right -- the 2-38's reference to 2-4 makes little sense. To fix this, you should
do the following
1. Replace the reference in 2-4 with a reference to 2-2.
2. When working 2-7, use the data from exercise 2-2 rather than 2-3.
By using the data from 2-2 in working 2-7, you will then have calculated the sample
average, median, and mode for that data and can refer to those number in 2-38 part c.
Box Plots
Question:
>Looking for those equations for the upper and lower boundries. Are they in the book,
could >not find the equations?
Answer:
The equations are not in the book as equations. The equations are referred to, implicitly,
in Figure 2-10.
Using the Computer for HW#1
Question:
Question on the homework #1. For the first few problems of
Chapter 2, are these to be done on the computer or can they be hand written?
Answer:
For the larger data sets, I would prefer that the problems be worked with
the computer. This is particularly true for the histograms. You can, however, do them by
hand.
Solutions
Grading Results for HW#1:
Homework #1 was graded in the following manner: Fifty percent of the score was
based on the existence of a solution attempt for each assigned problem. The
remaining 50% of the score was based on the correctness of three randomly chosen problems.
In this case, the three problems were 2-8, 2-12, and 2-30.
The overall scores on this first homework assignment were very high. Of the 119
students who are presently on the class roster (although some may have dropped),
ninety-nine students submitted homework assignments. The 20 students who did not
submit homework assignments received scores of 0. The analysis below was performed
with these "0" scores included. In the case of this homework assignment,
the scores of 0 could be interpreted as different from the remaining scores, and thus be
removed from the analysis. Would this have made more sense?
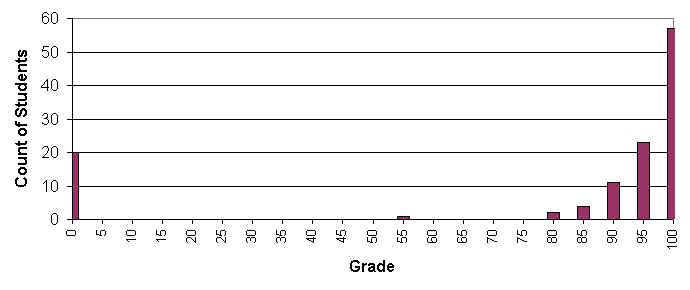
Below I have included the frequency and relative frequency table, a histogram of the
grades, and the standard Excel descriptive statistics on the grades. Again, the
scores are quite high, and the overall variability quite low. Notice the
difference, in the descriptive statistics, when I removed the scores of 0.
Overall -- good job on homework #1.
Frequency (and Relative Frequency) Table
Bin |
Frequency |
Relative Freq |
Cumulative % |
0 |
20 |
0.17 |
16.95% |
5 |
0 |
0.00 |
16.95% |
10 |
0 |
0.00 |
16.95% |
15 |
0 |
0.00 |
16.95% |
20 |
0 |
0.00 |
16.95% |
25 |
0 |
0.00 |
16.95% |
30 |
0 |
0.00 |
16.95% |
35 |
0 |
0.00 |
16.95% |
40 |
0 |
0.00 |
16.95% |
45 |
0 |
0.00 |
16.95% |
50 |
0 |
0.00 |
16.95% |
55 |
1 |
0.01 |
17.80% |
60 |
0 |
0.00 |
17.80% |
65 |
0 |
0.00 |
17.80% |
70 |
0 |
0.00 |
17.80% |
75 |
0 |
0.00 |
17.80% |
80 |
2 |
0.02 |
19.49% |
85 |
4 |
0.03 |
22.88% |
90 |
11 |
0.09 |
32.20% |
95 |
23 |
0.19 |
51.69% |
100 |
57 |
0.48 |
100.00% |
More |
0 |
0 |
100.00% |
Histogram of Grades
Descriptive Statistics
Homework 1 Grade (Scores of 0 Included) |
|
|
Mean |
78.81 |
Standard
Error |
3.31 |
Median |
95.00 |
Mode |
100.00 |
Standard
Deviation |
36.08 |
Sample
Variance |
1302.02 |
Kurtosis |
1.04 |
Skewness |
-1.70 |
Range |
100.00 |
Minimum |
0.00 |
Maximum |
100.00 |
Sum |
9378.18 |
Count |
119.00 |
Largest(1) |
100.00 |
Smallest(1) |
0.00 |
Confidence
Level(95.0%) |
6.55 |
Homework 1 Grades (Scores of 0 Excluded) |
|
|
Mean |
94.73 |
Standard
Error |
0.67 |
Median |
96.67 |
Mode |
100.00 |
Standard
Deviation |
6.65 |
Sample
Variance |
44.18 |
Kurtosis |
17.73 |
Skewness |
-3.36 |
Range |
48.48 |
Minimum |
51.52 |
Maximum |
100.00 |
Sum |
9378.18 |
Count |
99.00 |
Largest(1) |
100.00 |
Smallest(1) |
51.52 |
Confidence
Level(95.0%) |
1.33 |
|