Hylebos Watershed Spring 2003
Methods
Sediment Sampling
Sediment grab samples were taken approximately at the deepest part of the creek. One sample was taken using a small shovel. Sediments were collected and homogenized for analysis. Sediment wet weights were recorded before sediment samples were dried in oven for atleast 24 hours. Dry weight was recorded before sieve analysis was completed. Particle size and percentages were calculated. Sieve sizes used were >2mm, 2mm-1mm, 500 microns, 250 microns, 125 microns, 63 microns and <63 microns.
Flow Rate
Stream flow measurements were calculated at the sampling locations. Stream velocity measurements were done using the “orange method” which consists of determining a distance of travel while timing a neutrally buoyant rubber ball to an endpoint. This process was completed three times at all sites. Cross sectional area was measured in one foot intervals. Flow rate was then calculated from the stream velocity measurements and cross sectional depths. A vernier flow meter was also used to measure velocity at both locations.
Temperature
Water temperature was measured using both manuel and digital thermometers. The temperature was taken once with each thermometer at all sampling locations. Air temperature was taken using a Brunton digital thermometer.
pH
The Vernier was calibrated using manufacturer's specifications using calibration solutions of pH 4.0 and 7.0. pH was taken using a Vernier pH probe attached to the Texas Instruments Ti 83 plus scientific calculator. 125 ml Nalgene sample bottles were rinsed three times with sample water and the pH probe was placed into the bottle for a reading in the field.
Turbidity
The Vernier turbidity attachment was calibrated using distilled water and manufactures 100 NTU calibration solutions. The instruments sample bottle was rinsed three times, wiped using Kim wipes and then placed directly into the Vernier until measurement was recorded. The above procedure was repeated three times for both sites in the lab.
Dissolved Oxygen
The Vernier was calibrated using manufacturer's specifications and zero O2 calibration solution. The second calibration point was completed using distilled water. 125 ml Nalgene sample bottles were rinsed three times with sample water. Vernier D.O probe was placed into the sample bottle until a measurement was recorded in the field.
Nitrate
The Vernier probe was first soaked for 30 minutes in high standard solution (100mg/L). The instrument was calibrated using low nitrate standard(1 mg/L) and then high nitrate standards (100 mg/L). The calibration steps used are found in the manufacturer's specifications handbook. 125 ml Nalgene sample bottles were rinsed three times with sample water and samples were taken back to lab on ice for testing. The nitrate probe was attached to the Vernier instrument. The probe was placed into sample bottle for measurement. Nitrate readings were taken three times for each sample site.
Specific Conductivity
The Vernier was calibrated using both air and 1000uS/cm calibration solution. The calibration was completed using manufactures guidelines. The conductivity range was set at medium (0-2000 uS/cm). No other probes were attached to the Vernier while testing the streams specific conductivity. 125 ml Nalgene sample bottles were rinsed three times with sample water. The measurements were completed at the lab by placing the probe into the sample bottles.
Phosphate
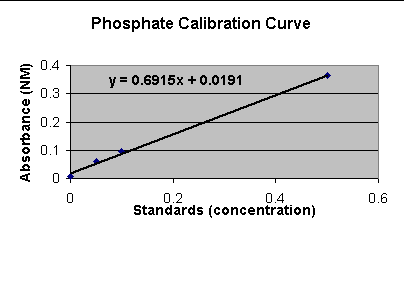
Three water samples were collected from each site. The water samples were collected from mid stream using 125 ml Nalgene bottles. The Nalgene bottles were rinsed three times before water samples were collected. The samples were taken back to lab for phosphate analysis using the Ascorbic acid method, Standard Methods pp 4-146, 147. The standards used were 0, 0.05, 0.10, 0.50 phosphorus per liter. Phosphorus concentrations were converted from absorbance (nm) to concentration (mg/L) using a phosphorus standards calibration curve.

Macro invertebrate Collection
Using a ruler, a one square foot quadrant was measured on the stream bed. A surber net was placed directly behind the measured quadrant. All rocks were individually wiped down by hand and then placed out side of the measured quadrant. The surber net was collected and all macro invertebrates were removed from the mesh net and brought back to the lab for identification and quantitative analysis. Macro invertebrate collection was completed once at all study sites except for at Seatac mall regional pond and 356th regional retention pond.

