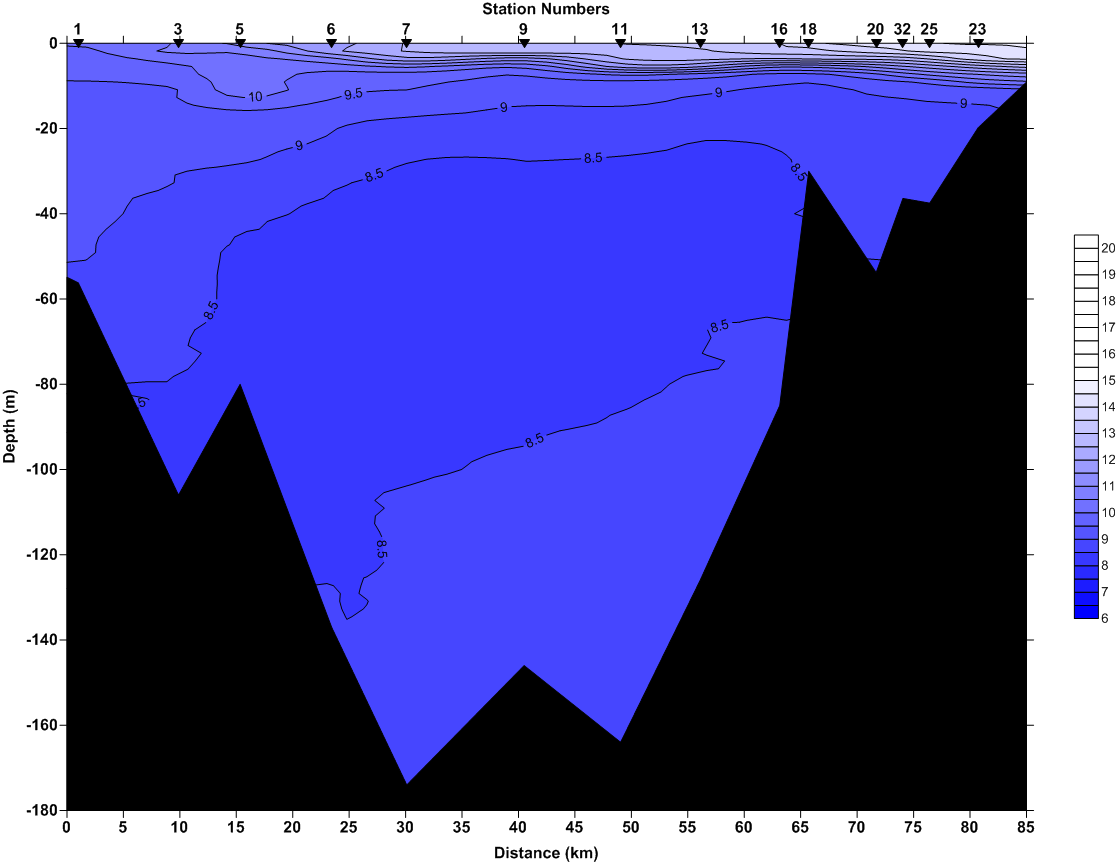
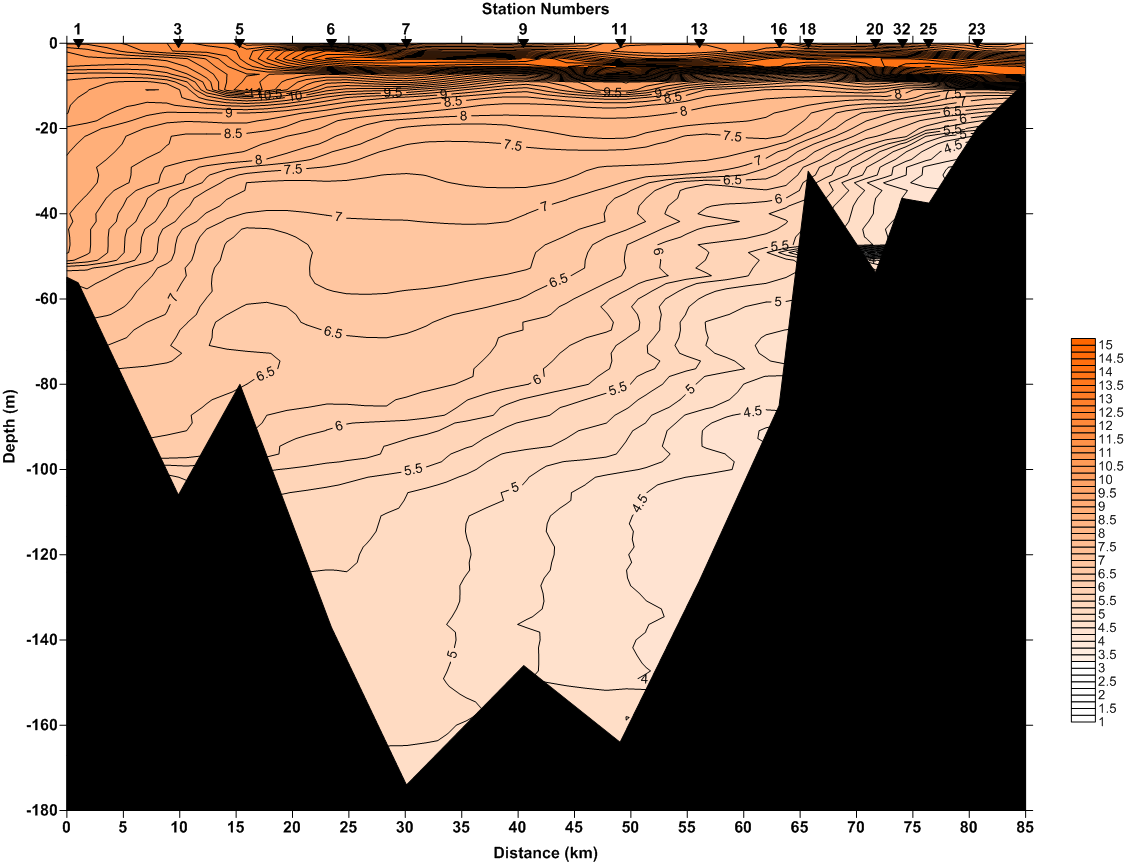
For all graphs, left to right moves from the north end to the south end of Hood Canal. In general, temperature decreased as depth increased. The stations on the north end of the canal tended to be cooler than the stations on the south end of the canal and stations in the south end were more stratified than the stations in the north. At all stations, temperature leveled out at around 8-9 degrees after the thermocline (10 meters). Notably, station 1 was well-mixed and stayed between 9 and 10 degrees Celsius. This is because station 1 is closest to the sill and the entrance to Hood Canal. Proximity to the sill also dictated the cooler temperatures in the north end of the canal.
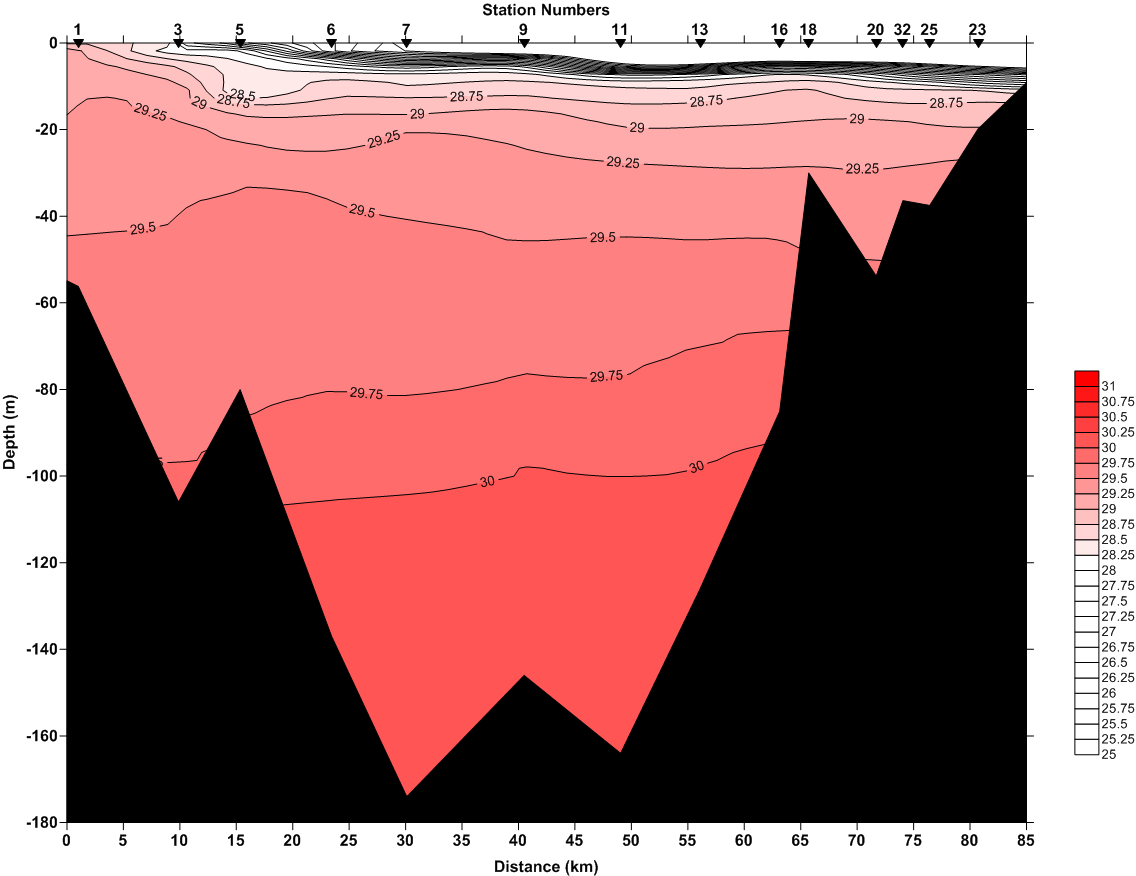
CTD Salinity (PSU)
In the stations close to the sill, there was little stratification with salinity levels between 28 and 29 PSU. As we moved further south, the water column became more stratified with lower salinity at the surface and higher salinity toward the bottom. This is due to the fresh water inflow from rivers in the south end of the canal. Surface salinity in the south was significantly lower than surface salinity in the north. As with temperature, salinity leveled out for all stations at the thermocline (10 meters).
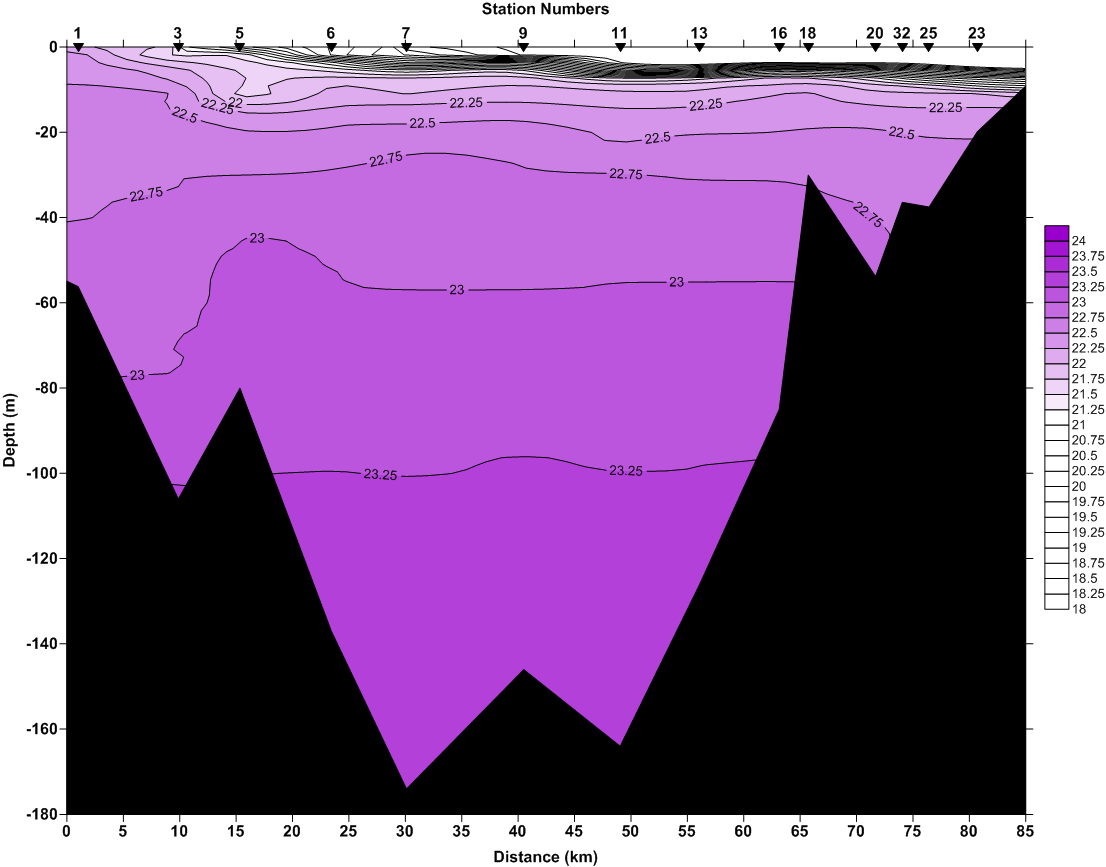
CTD Density (sigma-t)
As we can tell from the temperature and salinity profiles, density increases as depth increases. Density is driven by salinity. Water is cooler, saltier, and thus denser at the bottom of the water colum at all stations.
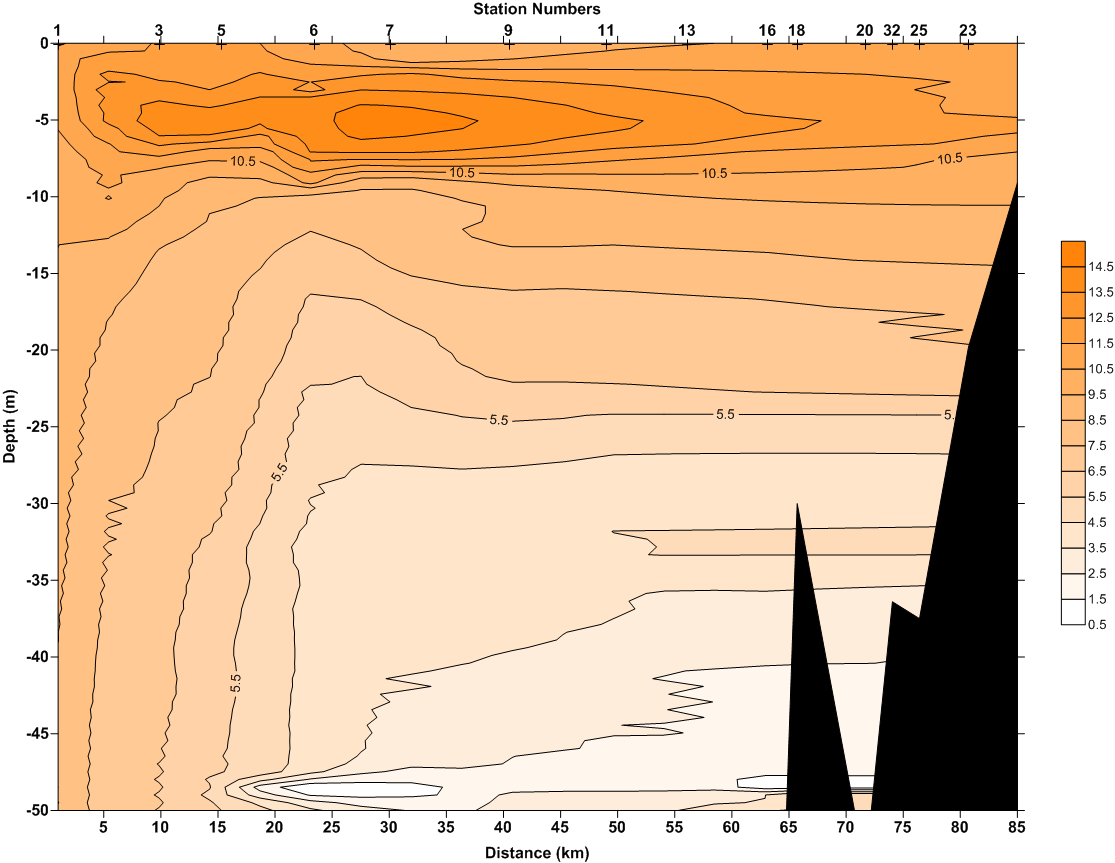
CTD Dissolved Oxygen (mg/L)
CTD Dissolved Oxygen (mg/L) up to 50 meters
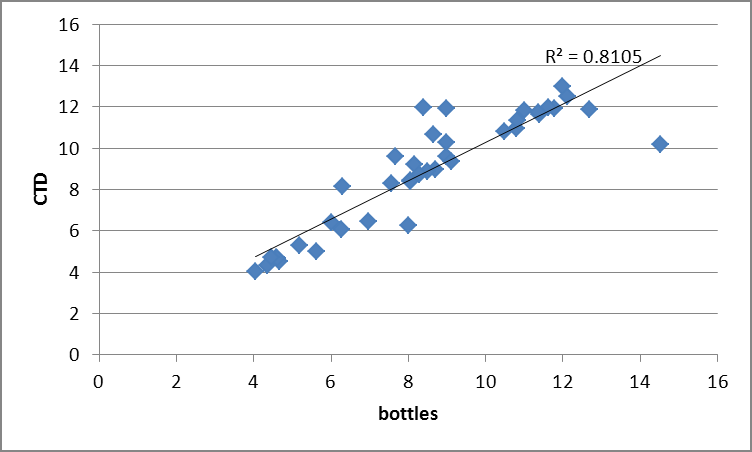
CTD DO vs. Discrete DO
Discrete DO and CTD DO data have a fairly good correlation, meaning that our data for discrete DO is reliable. All stations were between 10 and 15 mg/L at the surface. All stations spiked at around 15 mg/L at about 5 meters. High phytoplankton concentrations account for higher DO levels at 5 meters. DO at stations 20 and 25 dropped to 0 at the bottom. Stations with the lowest DO levels tended to be in the south end of the canal. This is because the south end of Hood Canal does not flush as quickly as the north end.
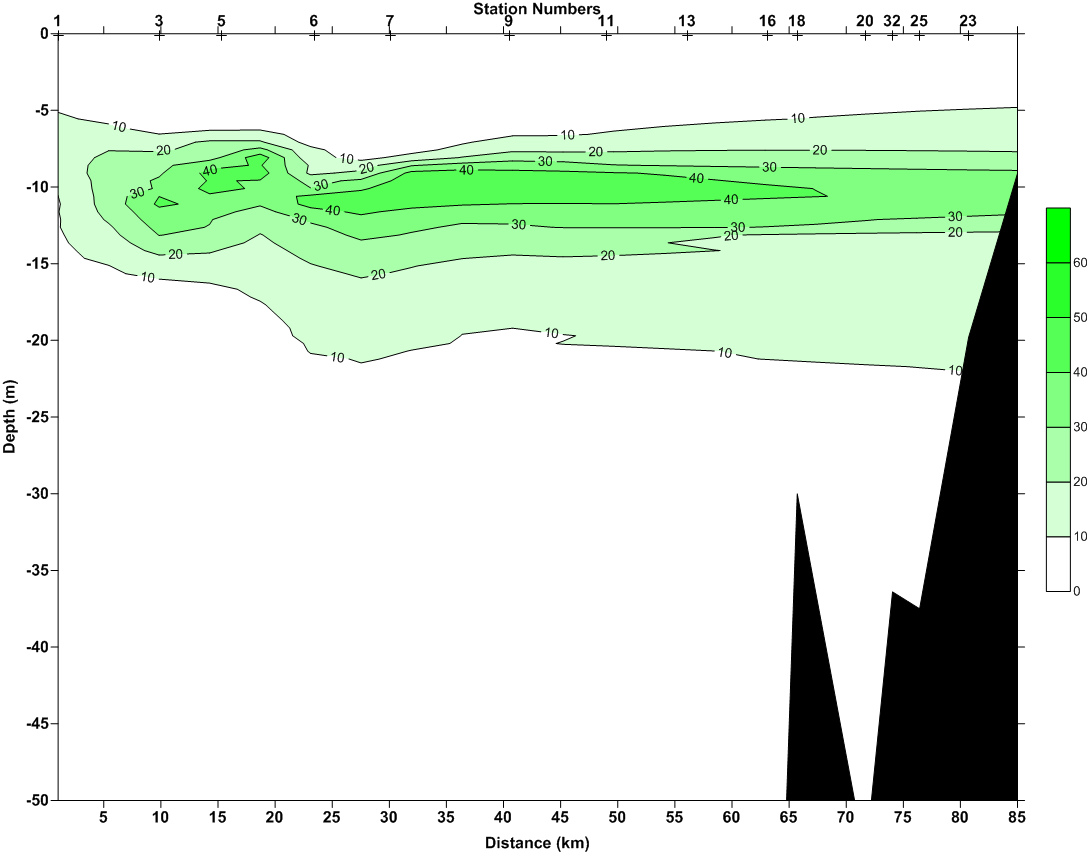
CTD Fluorescence (mg/m3)
>
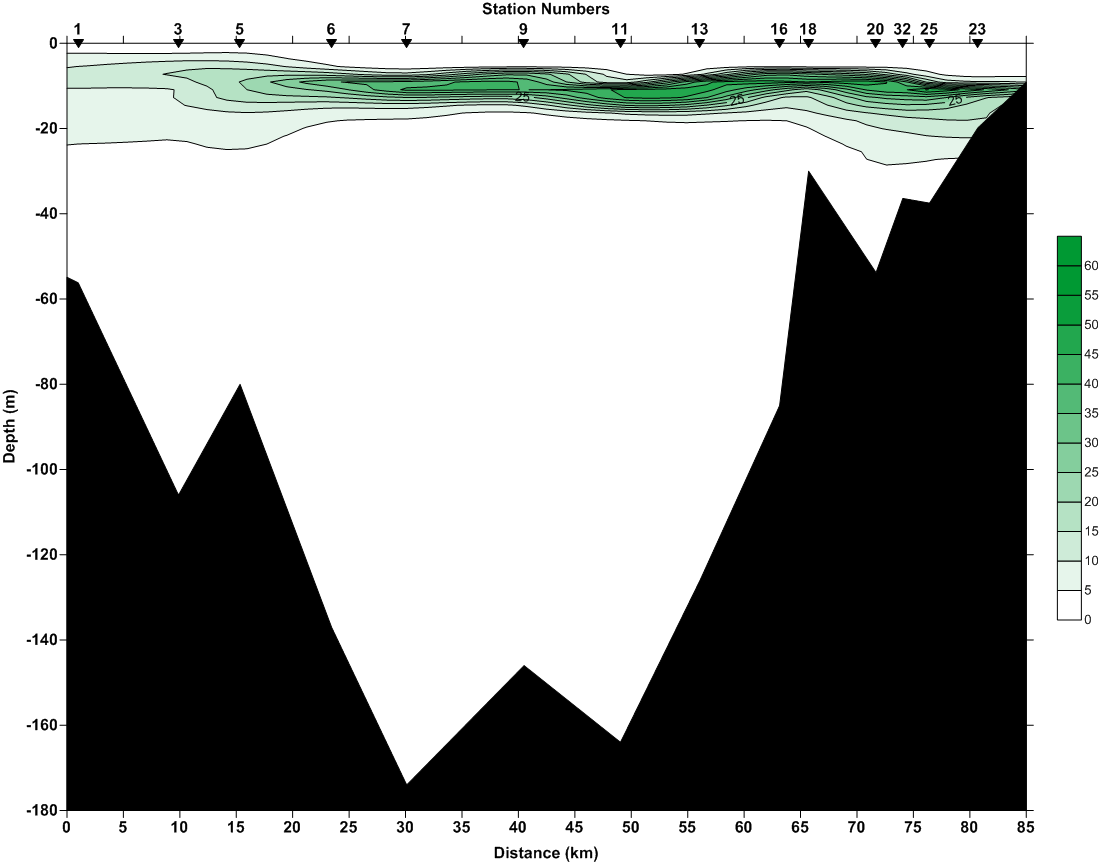
CTD Fluorescence (mg/m3) up to 50 meters
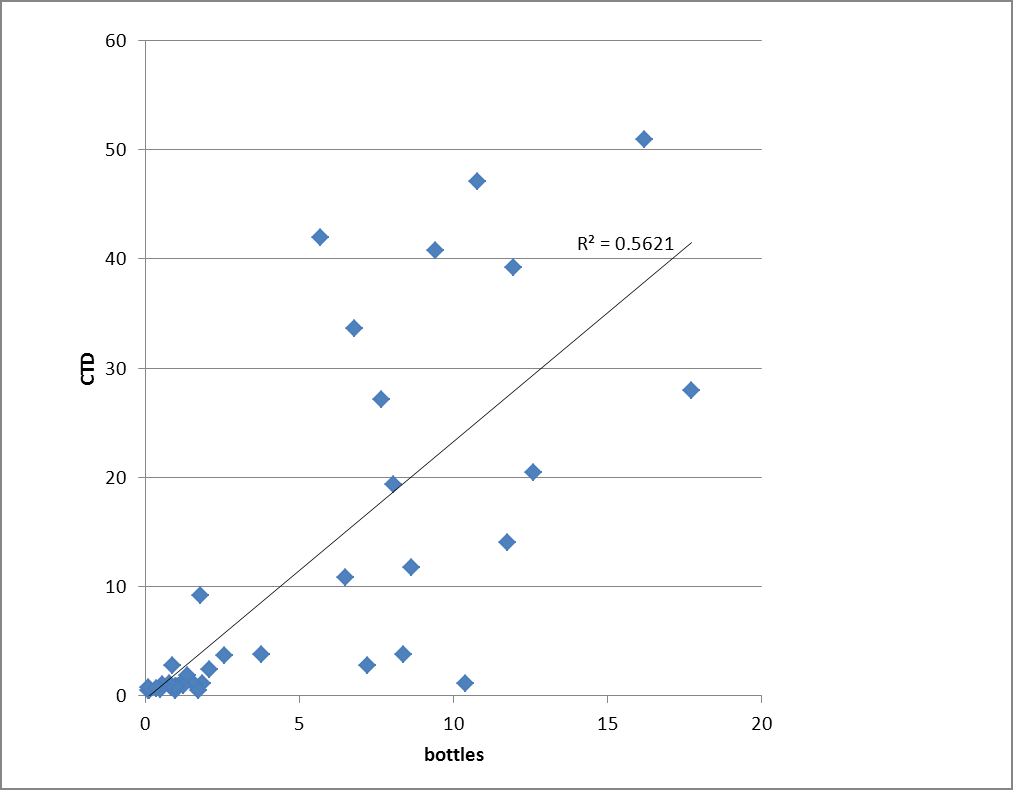
CTD Fluorescence vs. Discrete Chlorophyll
There was an moderate correlation between CTD fluorescence and discrete chlorophyll samples. Both CTD and bottle data can be looked at, but CTD data is much more accurate. Looking at the CTD data, we see a spike in fluorescence levels at the thermocline (approximately 10 meters). This shows that phytoplankton production is highest at the thermocline. At the surface, fluorescence is just above zero. It increases to the thermocline. Below the thermocline, fluorescence drops significantly. It decreases from 10-20 meters and drops to nearly zero below 20 meters.
CTD Transmissivity
Transmissivity varies throughout the water column. In the far north and the far south end transmissivity is lower due to vertical mixing at the sills. Transmissivity is lowest at the thermocline which matches the fluorescence data, which is highest at the thermocline. This indicates that there is a lot of phytoplankton and possibly other material at the thermocline. Slightly low transmissivity occurs at the bottom of the deepest stations. This is probably due to sediment moving through the bottom of the canal.
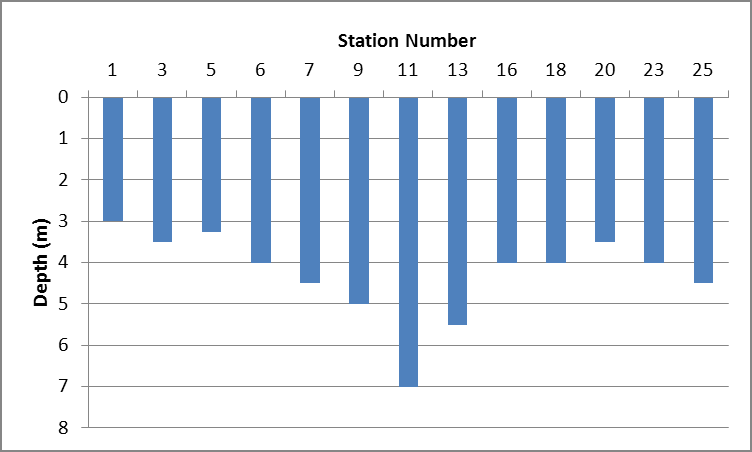
Secchi Depth
Secchi depth was between about 3 and 5 meters for every station except station 11. Station 11's secchi depth was 7 meters. Station 11 was the deepest station sampled which might account for this. Station 1 had the lowest secchi depth at 3 meters. This is probably due to the close proximity to the sill and the high velocity of water at that station.
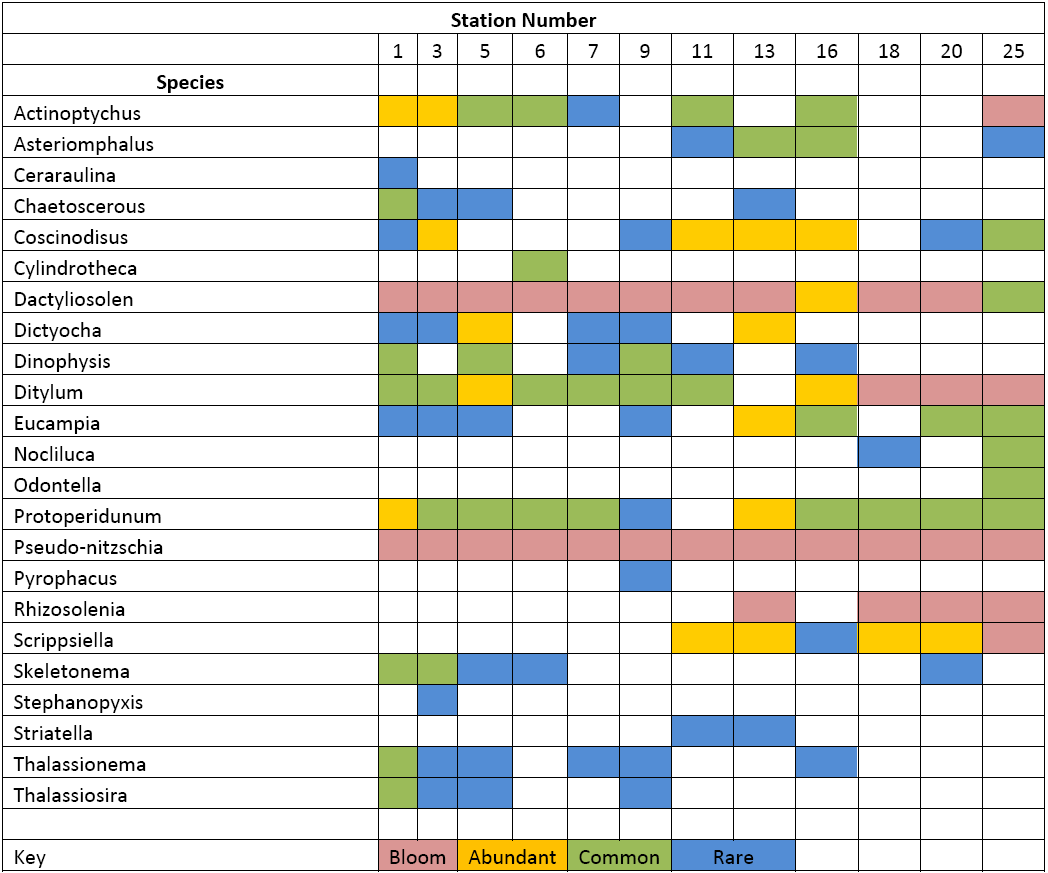
Phytoplankton Net Table
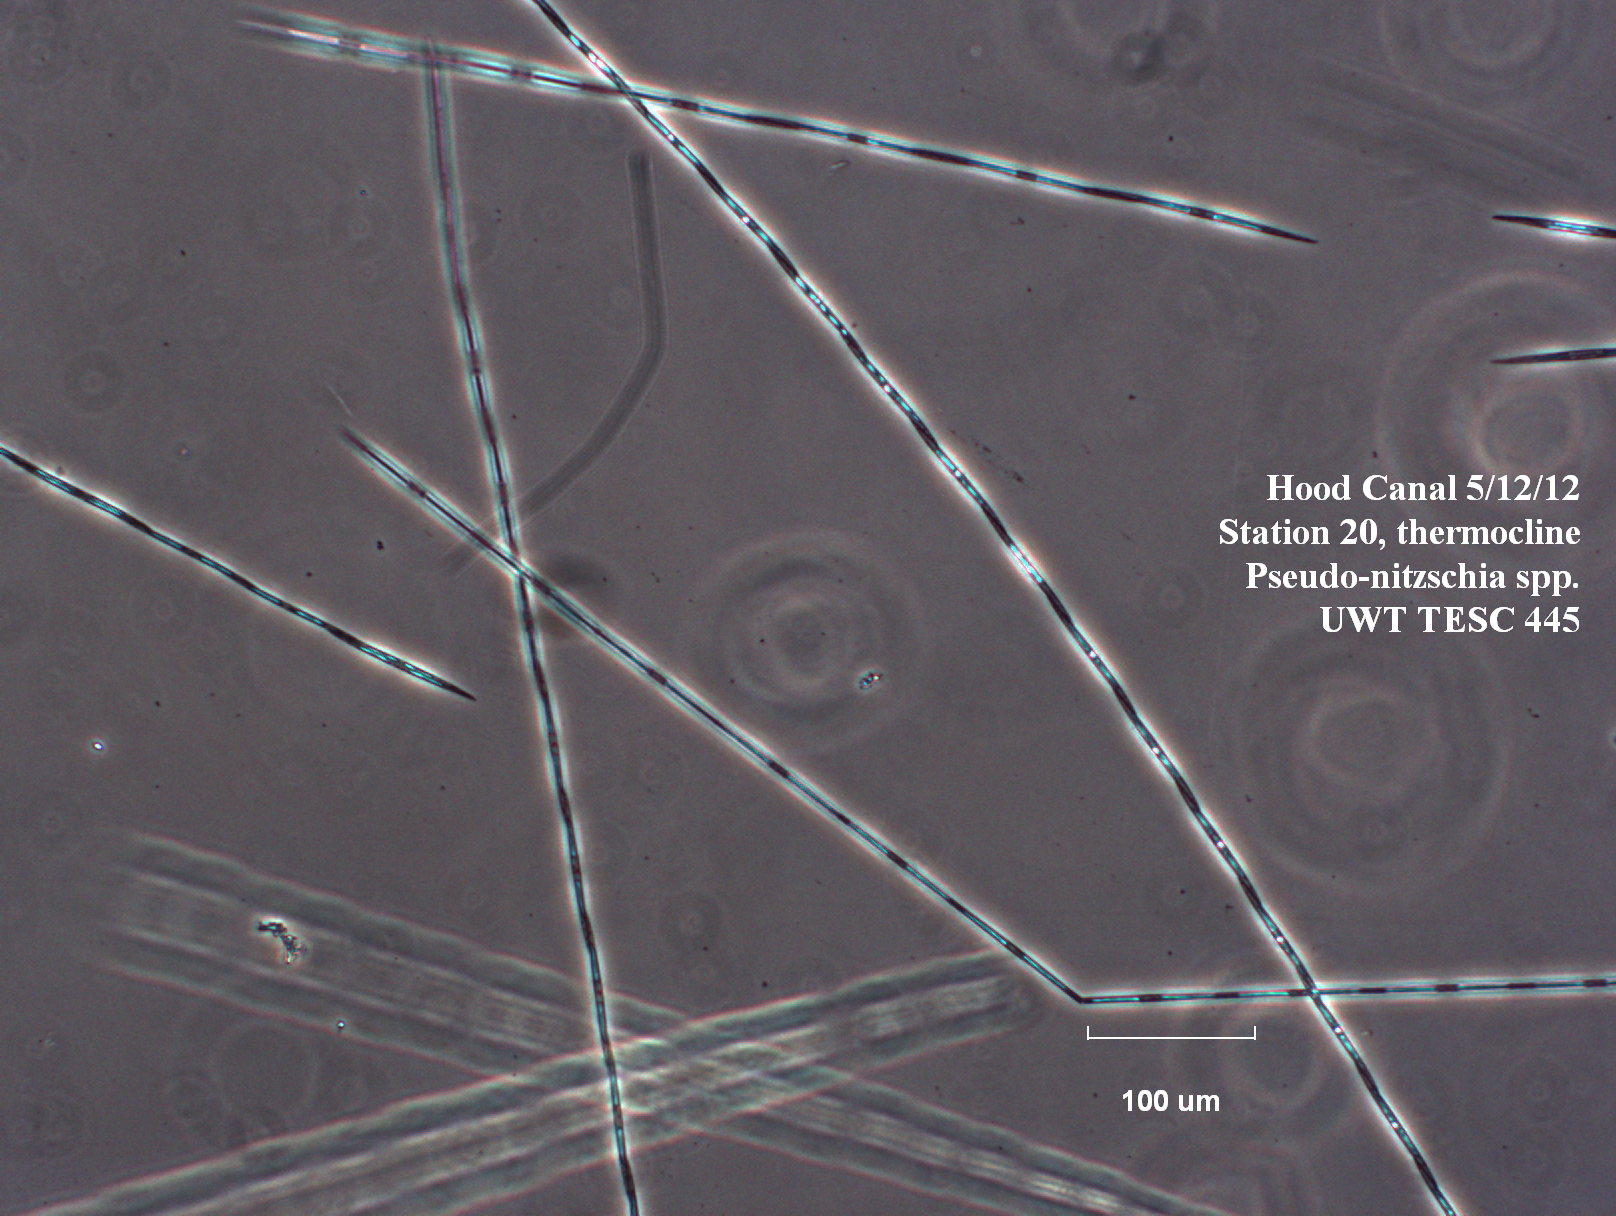
Phytoplankton is the base of the food chain, meaning all other organisms in the marine environment rely on phytoplankton for survival. Pseudo-nitzschia spp was blooming at every station. Dactyliosolen spp was blooming at every station except for stations 16 and 25.
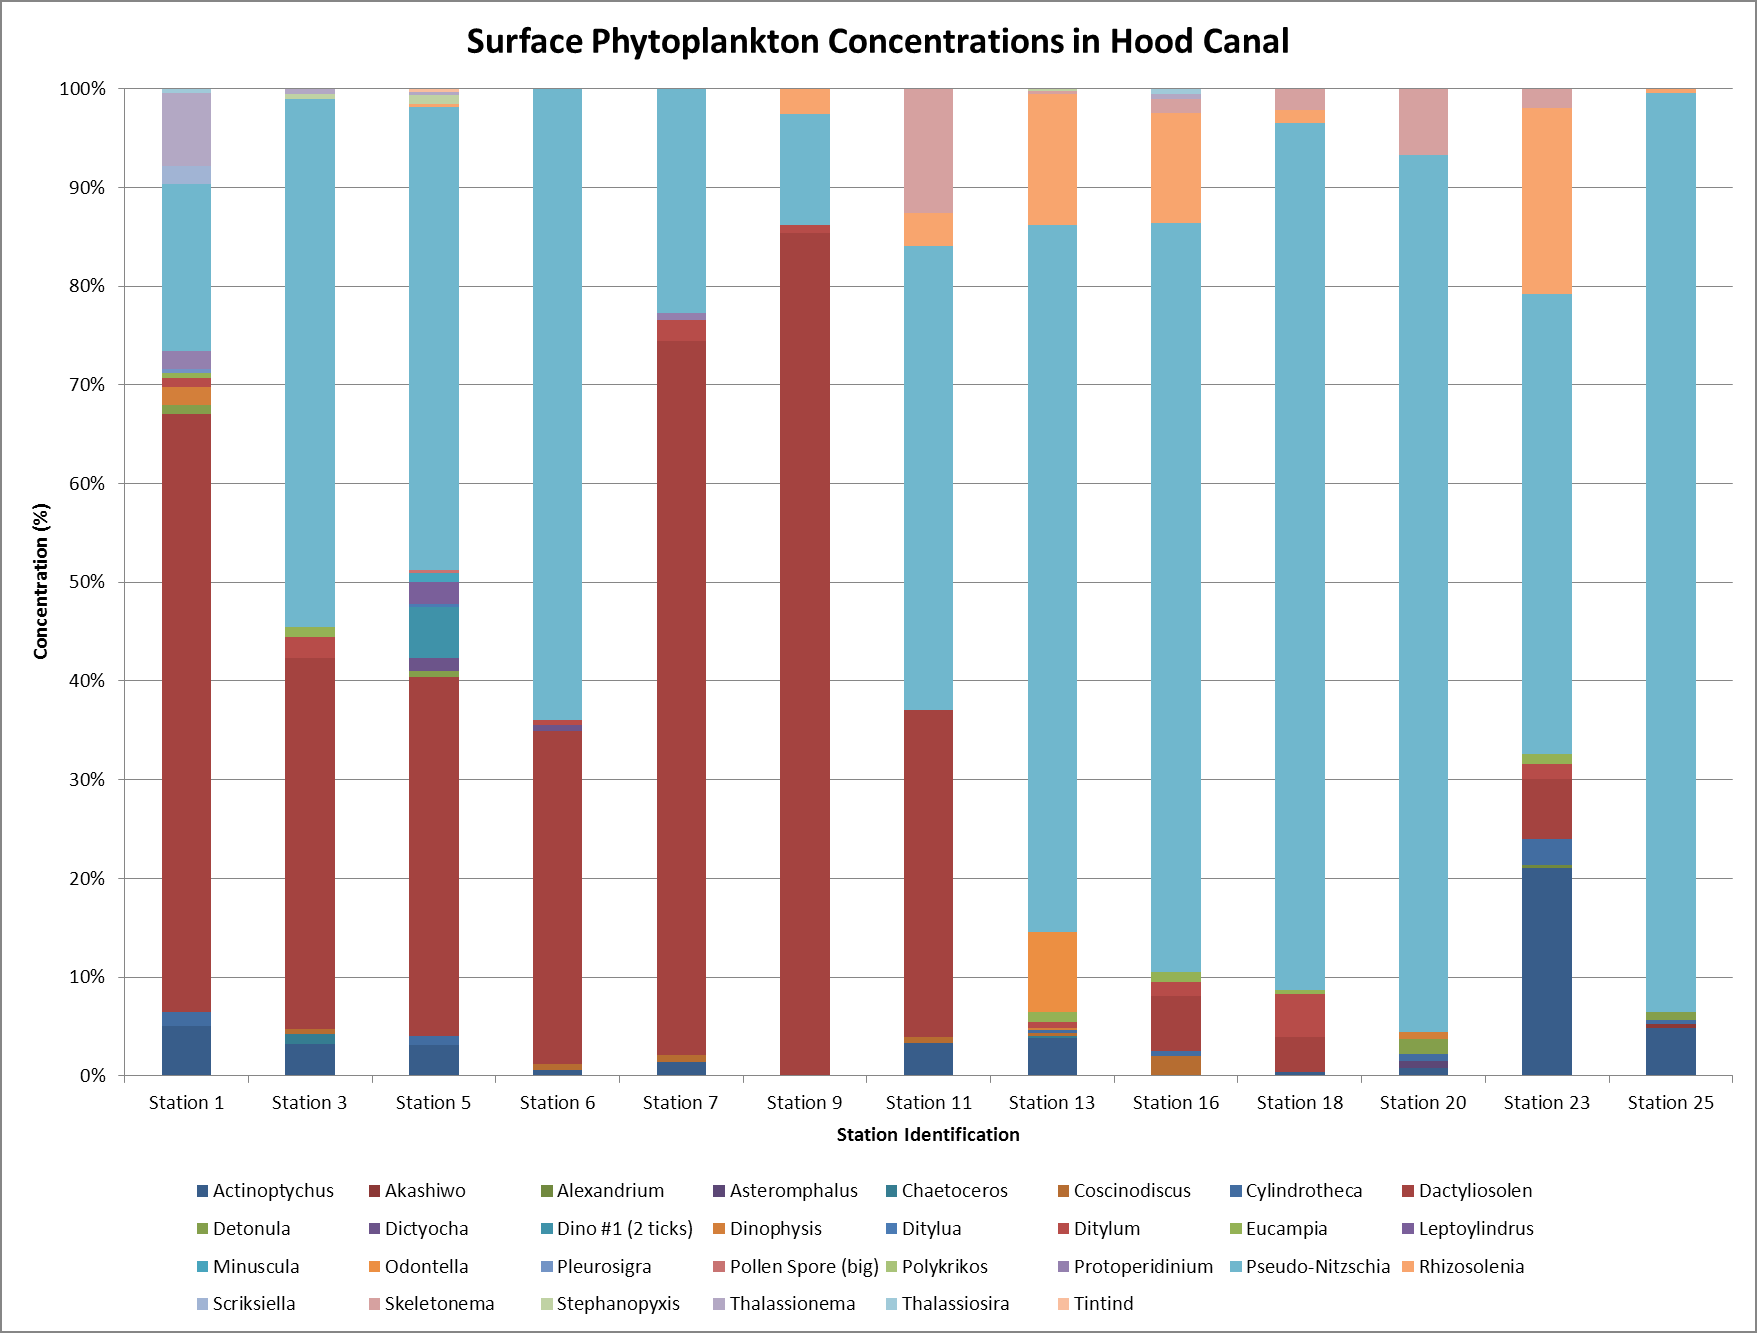
Phytoplankton Surface Concentrations
Surface phytoplankton was predominantly Pseudo-nitzschia spp and Dactyliosolen spp. This is because both are blooming at almost every station. The north end of the canal was dominated by Dactyliosolen spp while the south end was dominated by Pseudo-nitzschia spp.
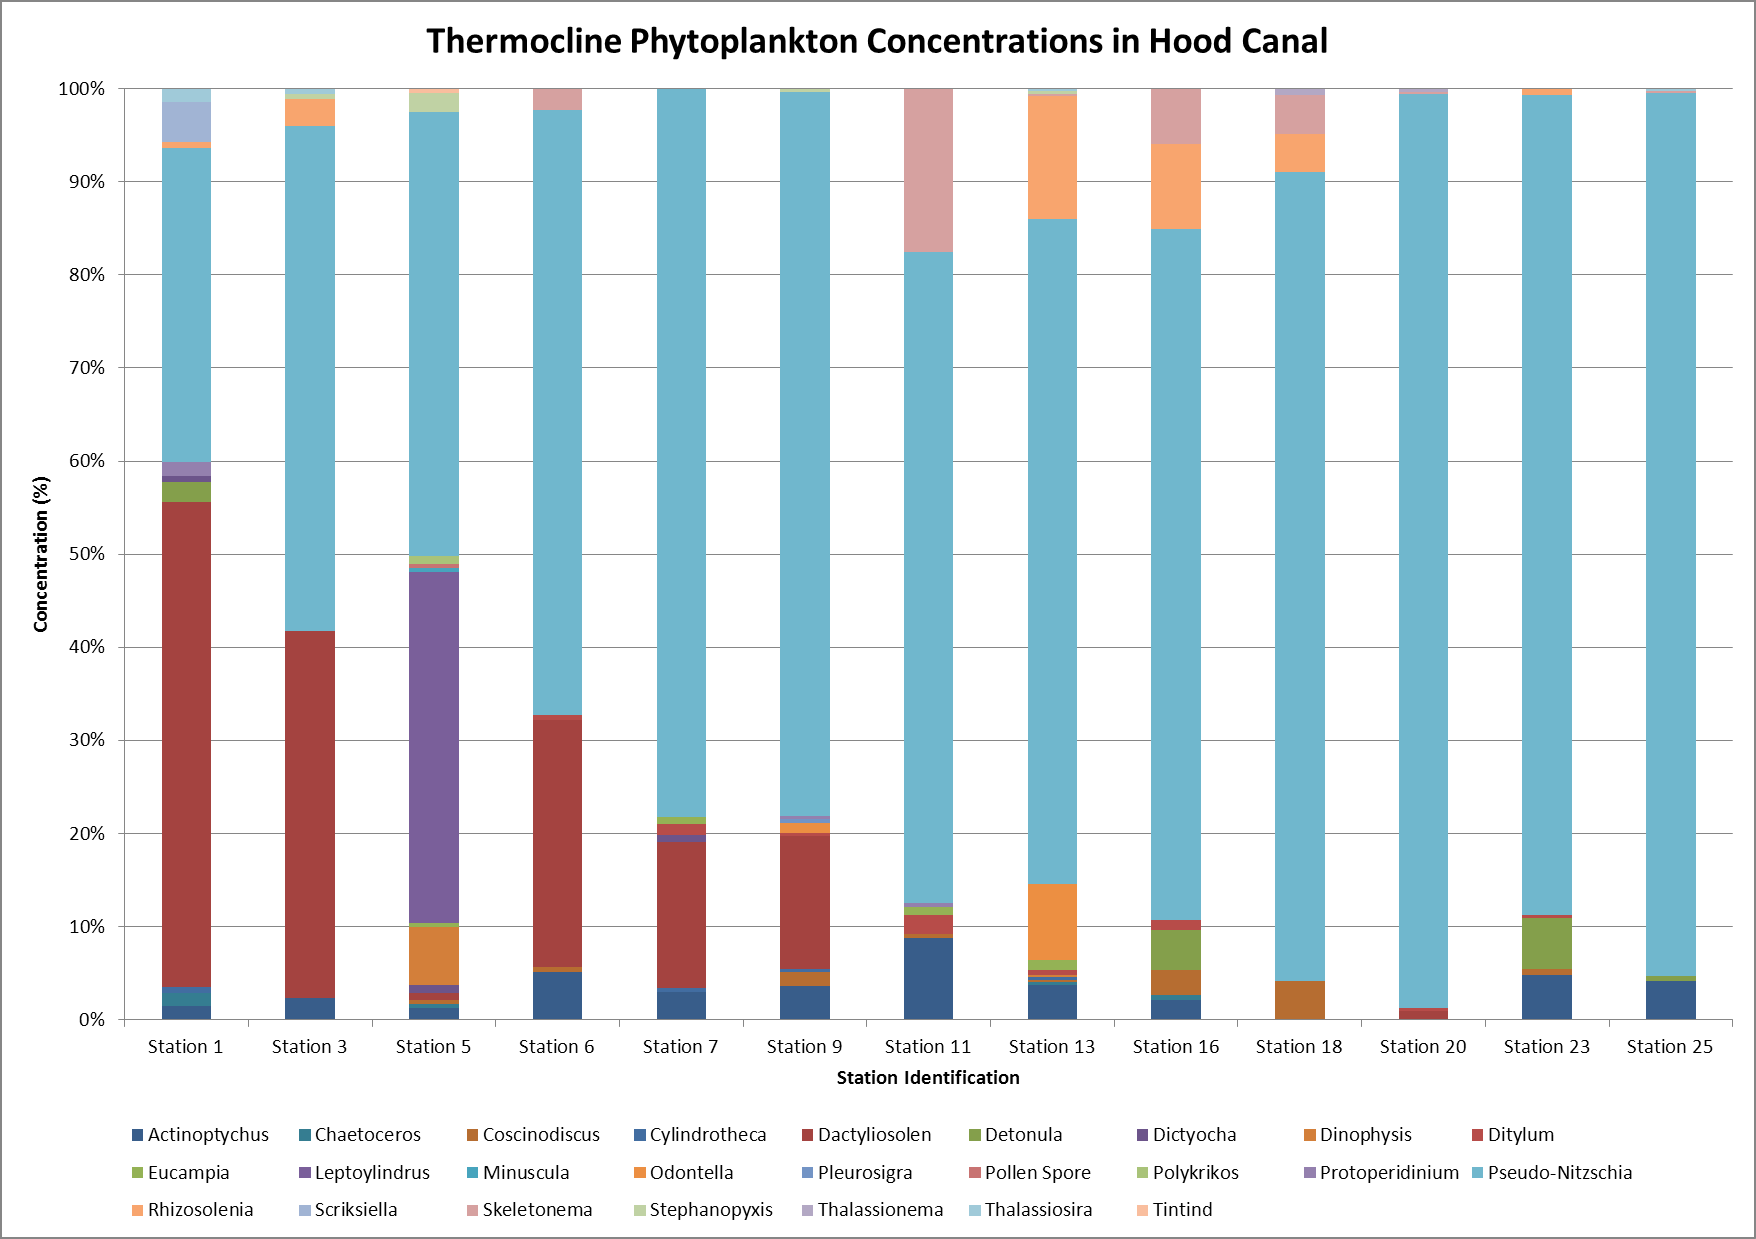
Phytoplankton Thermocline Concentrations
At the thermocline, phytoplankton was predominantly Pseudo-nitzschia spp at every station. Perhaps the other phytoplankton are less abundant because of the great abundance of the Pseudo-nitzschia spp.
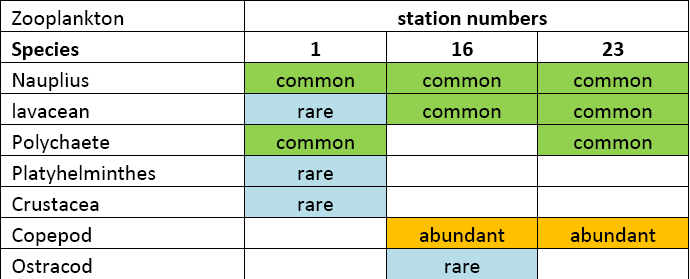
Zooplankton Net Table
Zooplankton were collected at stations 1, 16, and 23. We did not have a closing zooplankton net, so we only were able to collect a few zooplankton specimen. Nauplius spp were common at every station.
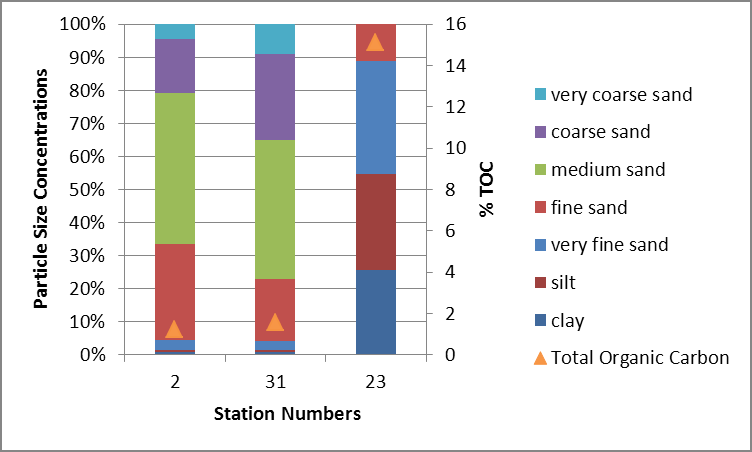
Sediment - Particle Size and Total Organic Carbon
Sediment samples were collected at stations 2, 23, and 31. Stations 2 and 31 were at the north end of the canal. These two stations had had a larger grain size and lower TOC levels than station 23. This is probably because of the effects of scouring by high-energy wave and currents in the north end of the canal.
 >
>