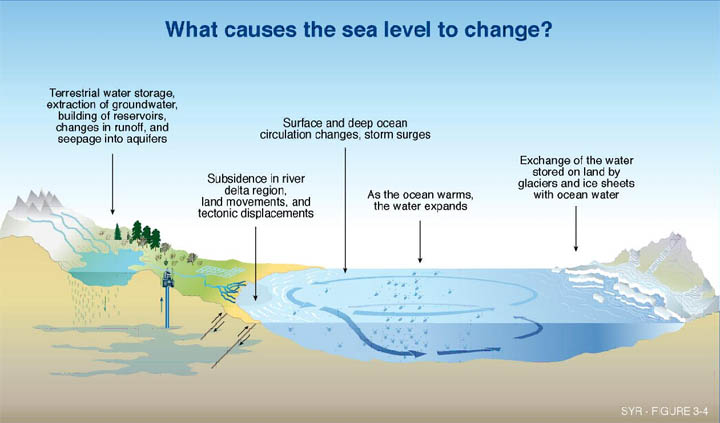
Why is sea level rising?
Earth is known as a watery planet. The
oceans take up about 2/3 of the surface of the earth. About
97% of the water on earth is in oceans, seas and bays.
There are two primary factors that cause
global sea level rise:
1) As the temperature of the ocean warms,
the water expands, leading to sea level rise.
2) Melting glaciers and ice sheets, as well as general exchanges between oceans and other reservoirs, can increase the amount of water in the ocean.
Picture from http://dcm2.enr.state.nc.us/hazards/slr.html#2
Sea
levels rose approximately seven inches during the past century,
which is more than in the previous century (Bindoff, 2007), and approximately ten times
faster than the rate of sea level rise during the past 3,000
years (IPCC, 2007). Sea
level rise is anticipated to be much higher during this century
(EPA, 2013). Estimates vary,
but projections from the International Panel on
Climate Change (2007) suggest an additional 7 to 23 inch
rise in global mean sea level by 2090-2099 relative to
1980-1999. Our current projections
based on data from the latest IPCC report runs, indicate 13-34
inches.
Local
sea level rise varies by region, and is caused mainly by the
combination of global sea level rise and local vertical land
movements (Canning, 2001).
In areas where the land is sinking, regional sea level rise will
be greater, and in regions where the land is rising, sea level
rise will be less severe. A major cause of vertical land
movement is shifts in plate tectonics. Other causes include
sedimentation and marsh accretion (the gradual build up of
sediment over time) (Glick et
al., 2007). Recent models have further attributed local
sea level height variations to tensions between gravitational
fields, such as those created by undersea mountain ranges (Spada et al., 2013).
How is sea level rise measured?
Before projecting sea level rise, we first need to collect some data to use in our models. See the What happens? page for details on the model fitting.
Today, we have two different techniques for measuring sea level:
1) Tide gauges
2) Satellite altimetry
Satellite altimetry (Topex/Poseidon and Jason satellites) can be used to measure sea level rise in the center of the oceans relative to the earth's center of mass, but the records only go back to 1992.
Tide gauges have much longer historical records (we use records going back to 1881) but they only measure sea level height relative to the land mass to which they are attached, which is probably moving. By taking into account simulated land motions (which we understand fairly well), and removing gauges in locations with more extreme tectonic activity, it is possible to produce estimates for global sea level height with relatively small uncertainty (Bindoff et al., 2007, Appendix 5.A.4.2).
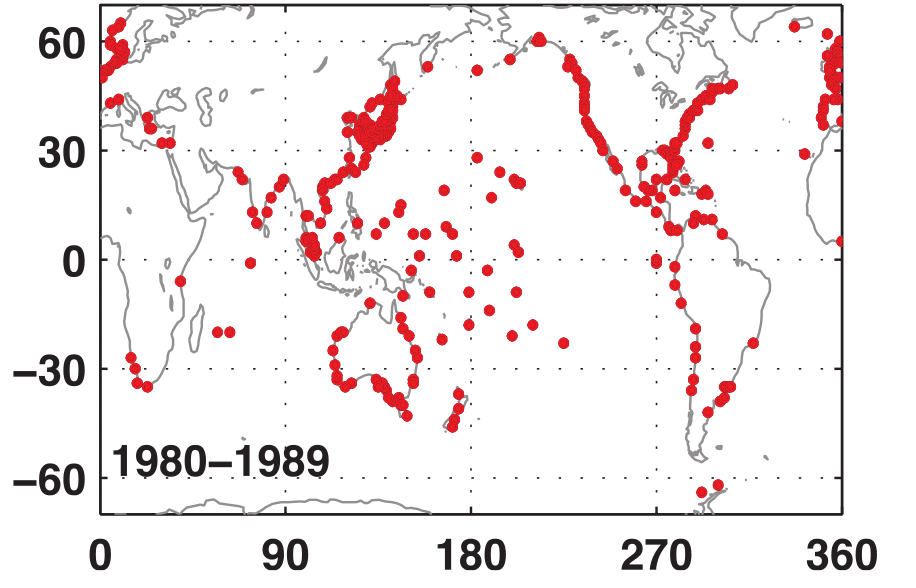
Locations of Tide Gauges (during
1980-1989). From: Bindoff et al. 2007.
Projections of sea level rise
So
how do we make projections into the future?
Around
the world, many different groups have put together complex GCMs
(general circulation models aka global climate models)
with the aim of using mathematical models aimed for simulating
the ocean or atmosphere of the earth. By combining models for
the ocean and the atmosphere along with simulations for sea ice
and land-surface components, these models can be used to project
different possible future scenarios.
Since
it is not known how we (individuals, cities, nations, or the
world) will act in the future, the best option we have is to set
up different scenarios of our possible future actions and run
them through the models to see how they impact the future
projections. For the sake of this project, we work with four
different projected RCPs
(representative concentration pathways) that the Intergovernmental Panel on Climate
Change plan to use for their fifth assessment report.
RCPs are greenhouse gas concentration
trajectories that are fed into the GCMs to use in GCM
projections. For our sea level projections, we use results from
18 different GCMs which each have
their own set of projections for each of the four RCPs of
interest during the 21st century.
RCP 2.6 - Assumes that the greenhouse gas concentrations reverse their current trajectory and decrease over the next century.
RCP 4.5 - Assumes that we stabilize our greenhouse gas concentrations at a relatively low level in the next century.
RCP 6.0 - Assumes that we stabilize our greenhouse gas concentrations at a higher level in the next century.
RCP
8.5 - Assumes that our greenhouse gas concentrations
do not stabilize in the next century and continue to grow.
See the Moss et al. 2010 Nature paper for more details.
References
[1] Bindoff, N. L., Willebrand, J., Artale, V., Cazenave, A., Gregory, J. M., Gulev, S., et al. (2007). Observations: oceanic climate change and sea level. IPCC Fourth Assessment Report.
[2] Canning, D. J. (2001). Climate variability, climate change, and sea-level rise in Puget Sound: Possibilities for the future. Puget Sound Action Team. Puget Sound Research, 2001 Proceedings.
[3] Craig, D. P. (1993). Preliminary assessment of sea level rise in Olympia, Washington: Technical and policy implications. Policy and Program Development Division, Olympia Public Works Department, City of Olympia [and] Washington Department of Ecology.
[4] Douglas, B., Kearney, M. T., & Leatherman, S. P. (Eds.). (2000). Sea level rise: History and consequences (Vol. 75). Academic Press. EPA (2013). Impacts of Sea Level Rise. Retrieved May 7, 2013, from http://www.epa.gov/climatechange/impacts-adaptation/coasts.html.
[5] Glick, P., Clough, J., & Nunley, B. (2007). Sea-level rise and coastal habitats in the Pacific Northwest: An analysis for Puget Sound, southwestern Washington, and northwestern Oregon. National Wildlife Federation.
[6] Huppert, D. D., Moore, A., & Dyson, K. (2009). Impacts of climate change on the coasts of Washington State. The Washington Climate Change Impacts Assessment: Evaluating Washington's Future in a Changing Climate. Climate Impacts Group, University of Washington. Seattle, WA.
[7] Intergovernmental Panel on Climate Change (IPCC) (2007). Climate Change 2007: The Physical Science Basis, Summary for Policymakers. Fourth Assessment Report, Intergovernmental Panel on Climactic Change, Geneva Switzerland.
[8] Moss, Richard H., et al. "The next generation of scenarios for climate change research and assessment." Nature 463.7282 (2010): 747-756.
[9] Spada, G., Bamber, J. L., & Hurkmans, R. T. W. L. (2013). The gravitationally consistent sea‐level fingerprint of future terrestrial ice loss. Geophysical Research Letters.
Contact: peter (at) stat.washington.edu