fhlranddfhlboots
MainIntroductionMethodsResults and DiscussionData Respository

TemperatureSalinityDensityDissolved Oxygen SecchiD.O ComparisonsFluorescenceChlorophyllPhytoplanktonZooplanktonSedimentsNutrients

San Juan Island Sufer Plots

All of the surfer plots shown below were done using the data provided from the CTD sampling on the R/V Centennial cruise April 26, 2014

As explained in the introduction, during this cruise the tide was entering the San Juan Channel region and caused large scale mixing throughout the water column.

Temperature (°C)
    temp

The temperature profile shows a very well mixed water column as the tide floods into the channel.   The profile also illustrates how a drop in temperature occurs as the water column is descended.  Near a depth of 70 meters,  which represents the thermocline, the temperature was 8.5-9 degrees Celsius and corresponds to a mass of oceanic upwelling.


Salinity (psu)
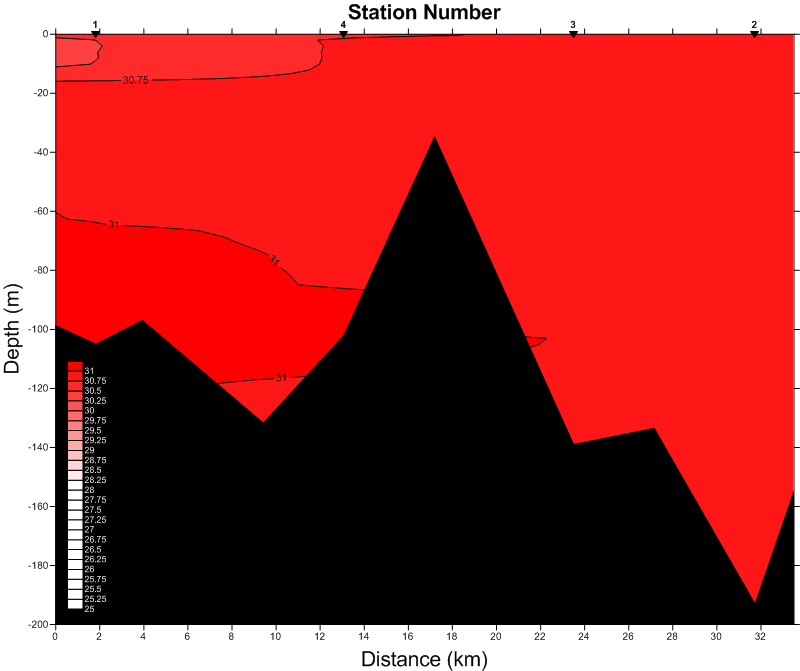
salinity

The upper portion of the salinity water profile is lightly mixed, but as the CTD descends the data profile reveals a mass of higher salinity oceanic upwelling entering the bottom of the channel. This mass of water is more dense, higher in salinity and colder since it is an oceanic upwell.  The overall salinity of the San Juan region is far higher than any of the other sample cruises completed during spring quarter 2014, with measurements reading beyond the maximum of the salinity scale at 31 psu. This is likely due to the fact that the San Juan sampling cruise is the farthest north and the closest to true oceanic water. Since this transect was significantly shorter than other transects, it is hard to predict how far the mass of oceanic upwelling traveled during one tide cycle. However, the unusually high salinity levels may suggest the reach of these oceanic masses is farther than we have anticipated and may be the same mass of high-nutrient upwelled water that causes low oxygen levels in the Hood Canal region. 


Density σ
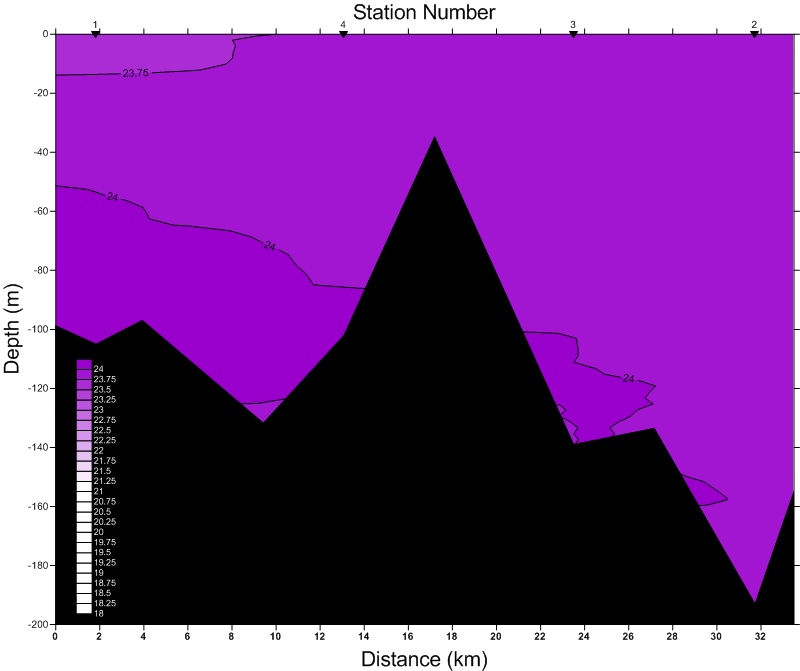
density
 

The density profile mirrors the salinity profile and shows the correlation between these two properties.  Again, the CTD data profile reveals a mass of very dense oceanic upwelling.  Just as the salinity, the overall density of the San Juan region is considerably higher than any of the other sample cruises completed this quarter. The profile maxed out at 24 σt  with a dense oceanic mass moving into the bottom of the channel.  Since this is the same mass discussed in the salinity profile, it is likely this dense water continues to travel south affecting the Hood Canal region. 


Dissolved Oxygen (mg/L)
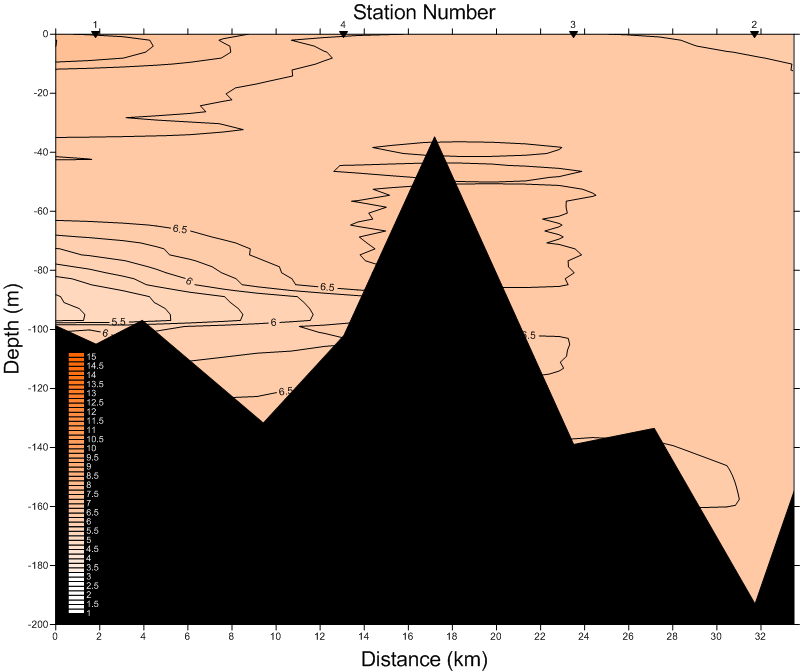
do

The dissolved oxygen profile demonstrates one of the most important characteristics of an upwelling ocean mass.  The  dissolved oxygen was remarkably low, with the highest levels reaching only about 10.5mg/L and occurring only in the top 20 meters of the mixed water column.  The oceanic upwelling mass is easily identified by the drop in dissolved oxygen when descending the water column.  Oceanic upwellings bring up “older,” water that has severe oxygen depletion, high CO2 levels, and high organic content.  These conditions contribute to an abundance of abundance of zooplankton and phytoplankton.


sechi
 

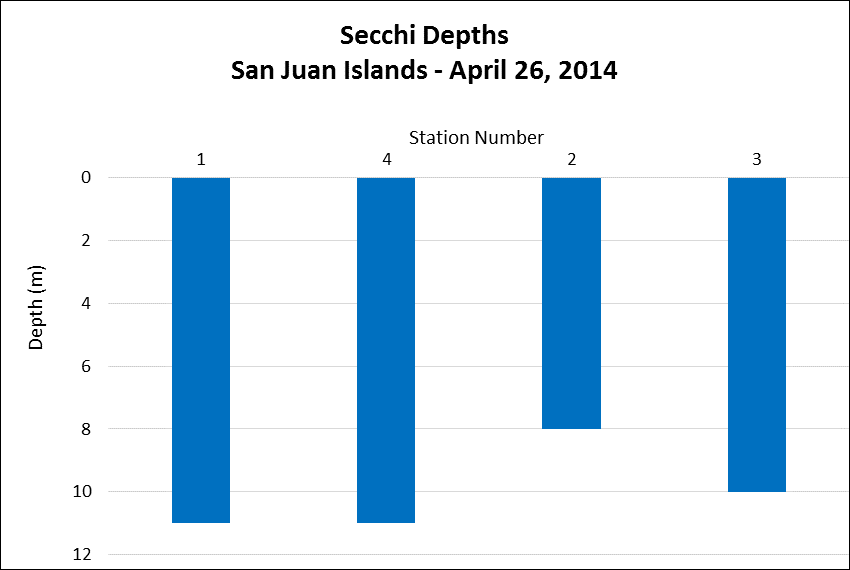
Secchi depths were all relatively close to each other in the 10-11 meter deep range.  This range of values is somewhat  deeper than the average depth for other sampling cruises.  Station 2, the northernmost point sampled, had the shallowest reading, at 8 meters.  The location of this point and heavily mixed waters were likely factors in the shallower reading. 


docomp

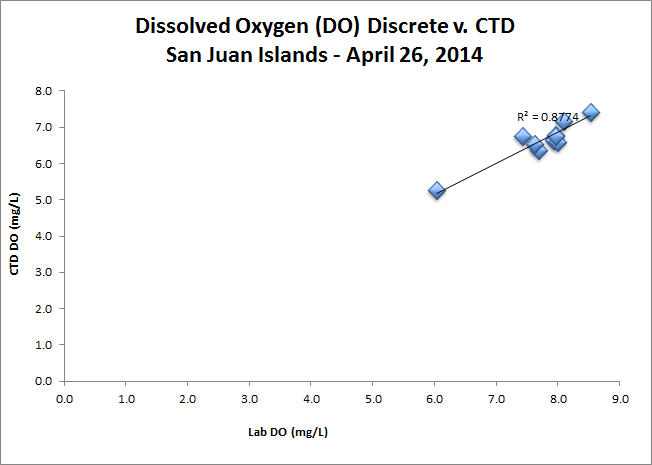
Comparison of CTD and discrete dissolved oxygen levels represents a linear trend that correlates with an R2 value of 0.8774. This value indicates the regression line fits the data well, establishing a strong correlation between the CTD data and the discrete data. The dissolved oxygen levels shown in the comparison graph are low compared to other sampling cruises due to the ‘old’ oceanic upwelling which is high in salinity, and low in dissolved oxygen.

Fluorescence (mg/m3)
fluorecence
Chlorophyll (µg/L)
chloro
 

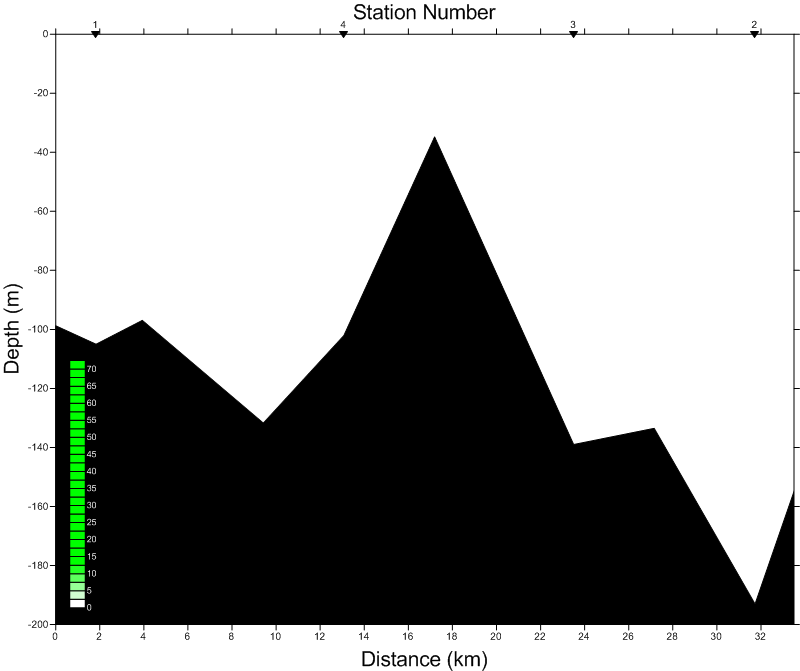
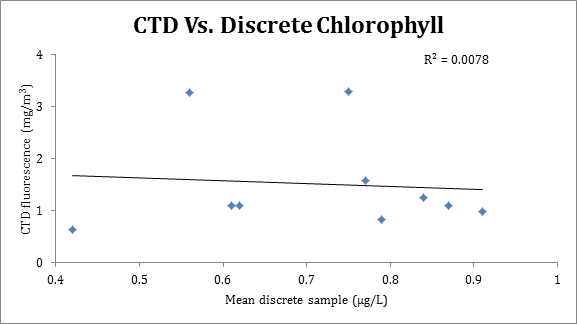
On the San Juan sampling cruise the CTD fluorometer data profile showed values so low that it did not register on the predicted scale when creating surfer plots.  As a result, fluorescence was registered at zero.  The CTD data has been checked multiple times and confirmed as correct. There was very little to no fluorescence in the water sampled. The discrete chlorophyll fluorometer used to analyze field samples as a basis for comparison to the CTD data malfunctioned, and as a result, no comparison is available for this sample.  The lack of fluorescence, however, can be attributed to the oceanic upwelling entering the channel.  The “old” water is perfect for starting a phytoplankton bloom, that does not yet contain many living phytoplankton.


phyto


chary
 

lep


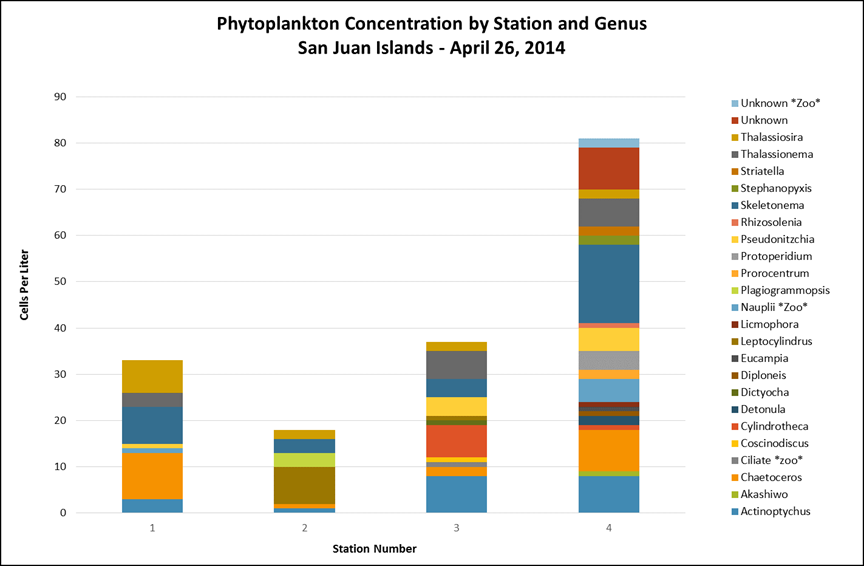
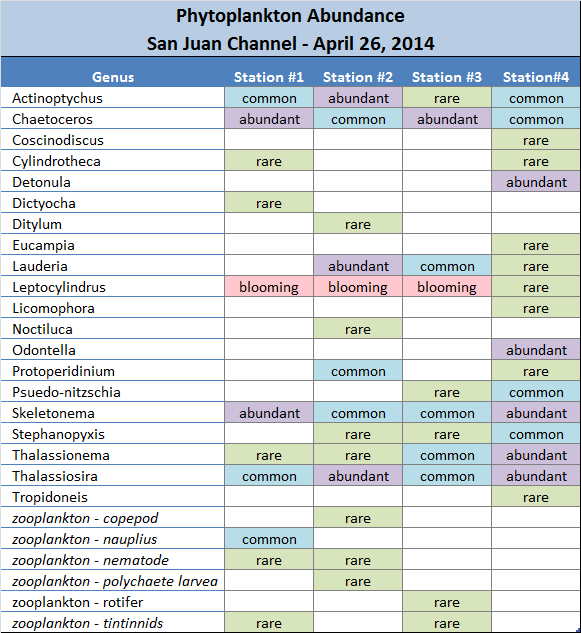
Surface counts show that Leptocylindrus spp. dominated the water column at stations 1 and 2.  Stations 3 and 4 were more heavily dominated by Thalassionema spp., Actinoptychus spp., Chaetoceros spp., Pseudonitzchia spp., and Skeletonema spp. Both Leptocylindrus spp. and Thalassionema spp. are Diatoms. Diatoms bloom in early to mid-spring before dinoflagellates are able to bloom. Diatoms use silicate to form their tests. Pictured to the left is a specimen of Leptocylindrus spp.


zoo

naup

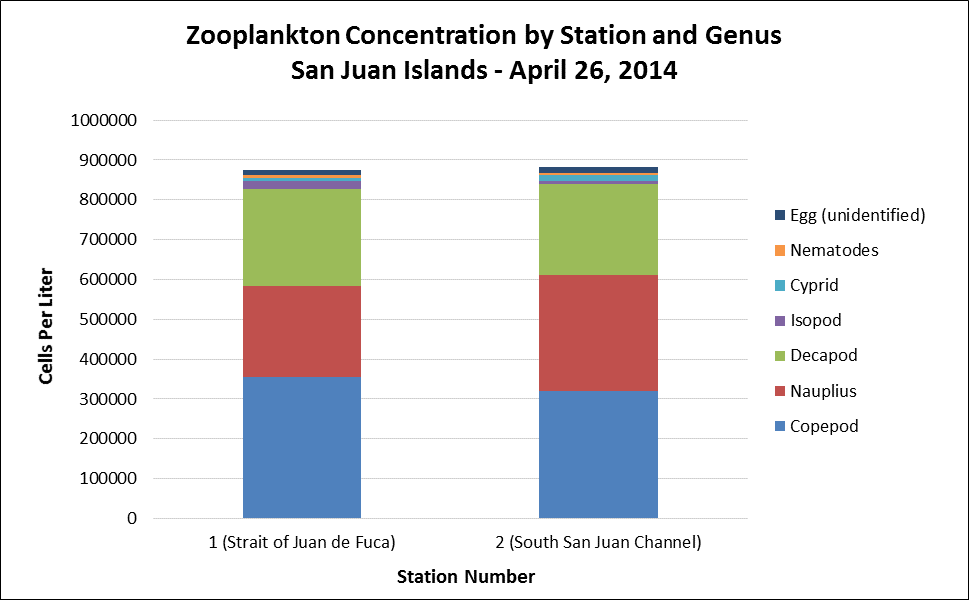
Zooplankton net samples indicated fairly even distributions of zooplankton at both sampling locations. When sorted by percent volume, data indicates that both stations 1 and 2 are dominated by Copepods, Decapods, and Nauplii. All of the listed zooplankton are extremely common in the spring and summer seasons in estuarine waters. These organisms are all fairly tolerant and thrive in a wide range of conditions. Pictured to the left is a Nauplius spp


                         sedpsa

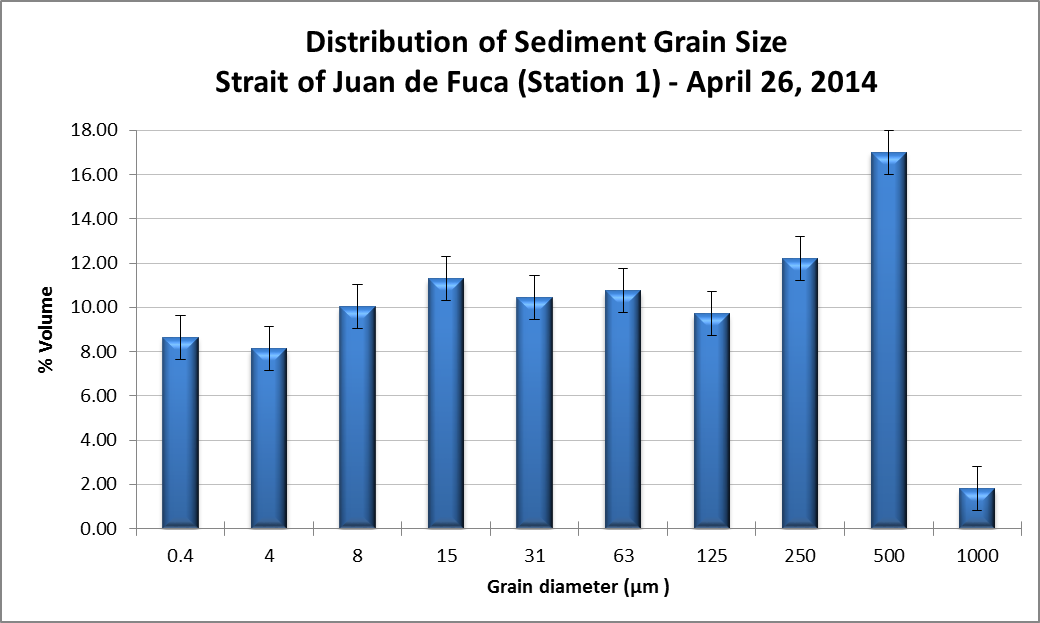
The sediment sample, taken only from Station 1, was marked by a wide range in grain size.  Particles in this sample ranged from 0.4-1000 µm in diameter, indicating a consistency from clay to very coarse sand. The most abundant grain size for this sediment sample was 500 µm, which indicates the sediment was more like coarse sand than clay, and more likely to hold organic compounds.


                                              sedstoc

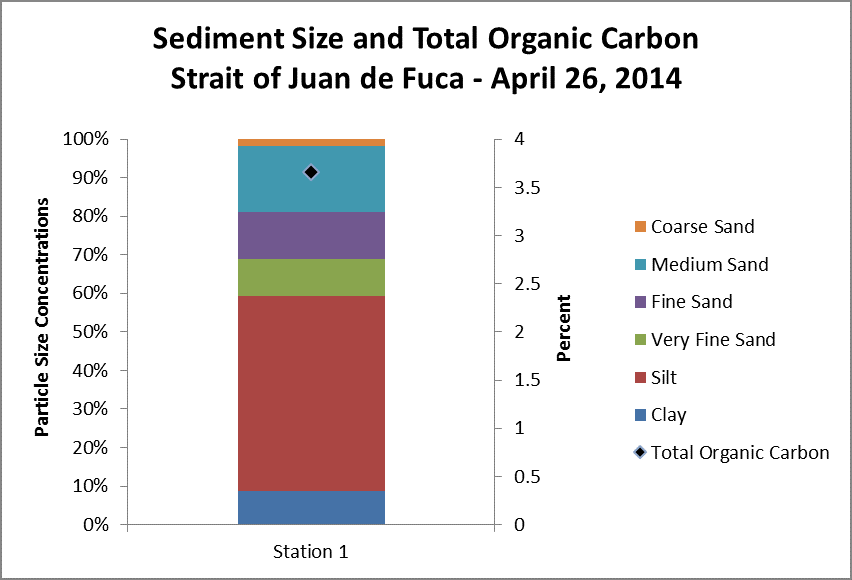
Compared to 2012 data, current results indicate a much higher percentage of total organic carbon.   The 2012 data showed sediments contained 2.4 percent total organic carbon while 2014 sediment analysis revealed a higher percentage, at 3.7.  Multiple factors may be involved in the difference.  This could indicate a change simply due to location of the sediment capture, or the difference in the seasonality of the sample. The upwelling of a nutrient-rich ocean water mass contributes to blooming of phytoplankton and zooplankton, which can raise the total organic carbon levels in sediment as these organisms expire.    


Nutrients (µM)
chart
table

The nutrient levels in stations 2, 3, and 4 demonstrate the amount of mixing created by the incoming tide. The surface and bottom Si(OH)4 levels varied only by 1 µm or less and showed the nutrients were marginally stratified with the bottom being higher in Si(OH)4. Station 1 differed from the other stations due to its location at the south end of the San Juan Channel, and as a result is far more stratified between the bottom and the surface nutrients.  


References

Capone D, Hutchins D. 2013.  Microbial biogeochemistry of coastal upwelling regimes in a changing ocean.  Nature Geoscience 6(9): 711-717

Davenne E, Masson D.  2001.  Water Properties in the Straits of Georgia and Juan de Fuca.  [Internet.]  [cited 2014 May 8].  Available from   http://staff.wwu.edu/stefan/SalishSea/WaterPropStGeorgiaJuanDeFuca.pdf

 Hyde D. 2014.  Ocean circulation, sedimentation in the San Juans’ a compilation of mainstream scientific literature.  [Internet.]  Common Sense Sea Alliance.  [cited 2014 May 8].  Available from http://www.commonsensealliance.net/files/images/pdf/Science/43-Hyde%20Ocean%20Circulation%20in%20the%20San%20Juans%208-12%20copy.pdf

 Juan de Fuca Strait [Internet]. Ch 11.  [cited 2014 May 9].  Available from http://www.dfo-mpo.gc.ca/Library/487-16.pdf

[NOAA] National Oceanic and Atmospheric Administration. 1978.  Circulation in the Strait of Juan de Fuca.  [Internet.]  Report NO.: ERL 399-PMEL 29.  [cited 2014 May 5].  Available from http://www.pmel.noaa.gov/pubs/PDF/cann440/cann440.pdf

[NOAA] National Oceanic and Atmospheric Administration [Internet.] Silver Spring (MD): Center for Operational Oceanographic Products and Services; [cited 2014 Jun 6].  Available from http://tidesandcurrents.noaa.gov/waterlevels.html?id=9449880&units=metric&bdate=20140426&edate=20140426&timezone=LST/LDT&datum=MLLW&interval=6&action=

Strickland R.  1983.  The fertile fjord.  Seattle (WA):  Washington Sea Grant Program, University of Washington.

 Zamon J.  2002.  Tidal changes in copepod abundance and maintenance of a summer Coscinodiscus bloom in the southern San Juan channel, San Juan Islands, USA.  Marine Ecology Progress Series.  226:193-210


Back to top
MainIntroductionMethodsResults and DiscussionData Respository